10.3 Graphing Inequalities
Linear Inequality in Two Variables
A linear inequality in two variables can be expressed as:
1) a x + b y > c
2) a x + b y < c
3) a x + b y < c
4) a x + b y > c
Inequalities can also be written using the form y = mx + b.
The graph of a linear inequality is a half-plane bounded by the line, whether it's written in the form ax + by = c. To graph the linear inequality, first sketch the line ax + by = c. If the inequality is < or > , draw a solid line. If the inequality is < or >, use a dashed line. Then pick a point that does not lie on the line and plug it into the inequality. If the statement is true, shade the region on the graph that includes the point. If the statement is false, shade the other region. When a region is shaded, it means that any point in that region solves the linear inequality.
Illustrative Example
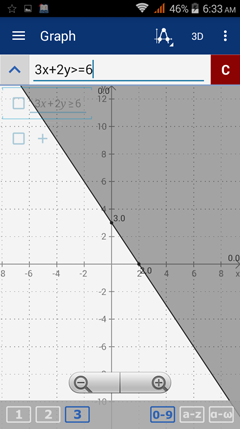
Sketch the graph of 3x + 2y > 6.
Manual solution
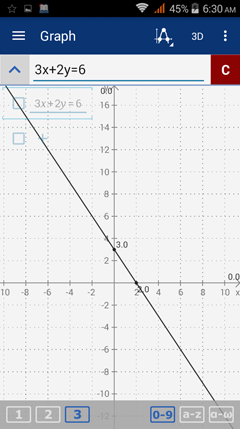
Step 1: Sketch the line 3x + 2y = 6.
Since the original inequality contains an equal sign, we use a solid line.
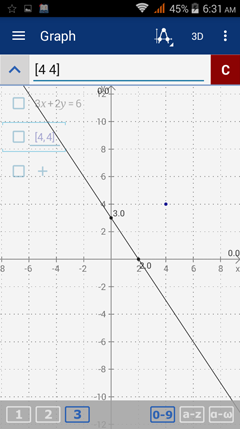
Step 2: Identify a test point.
We can use (4, 4) as a test point since it is not on the line.
We can use (4, 4) as a test point since it is not on the line.
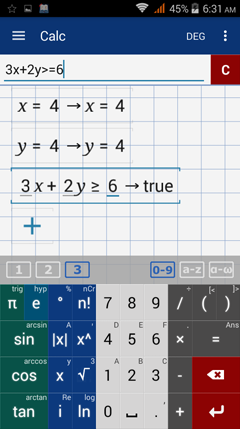
Step 3: Plug the point into the equation of the line and determine whether the statement is true or false.
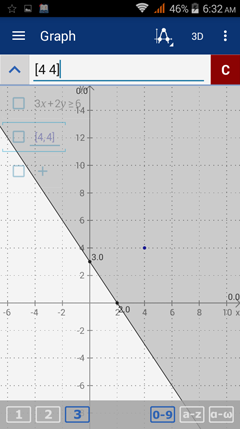
Step 4: If the statement is true, shade the region that includes the test point. If the statement is false, shade the opposite region. Since the statement is true as shown above, we shade the region that includes (4, 4).
Calculator solution
Type in the inequality as it appears: 3x + 2y >= 6. The shading is done automatically.
Type in the inequality as it appears: 3x + 2y >= 6. The shading is done automatically.
Graphing Other Types of Inequalities
Other types of inequalities (absolute value, rational, conics) are also graphed with a shaded region where the inequality is "true." To find this region, graph the equation of the inequality by changing the > or < symbol to an equals sign ( = ). Then evaluate the inequality at a test point. If the test point makes the inequality true, shade the region that includes the point.
Note: for rational inequalities, you have to consider test points from several intervals respectively.
Note: for rational inequalities, you have to consider test points from several intervals respectively.
Examples
Sketch the graph of each inequality on a separate coordinate system.
Sketch the graph of each inequality on a separate coordinate system.
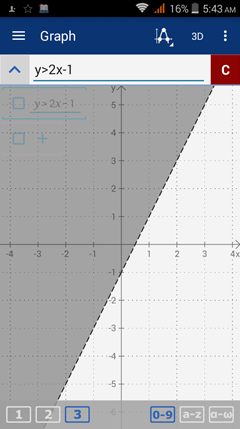
1. y > 2x-1
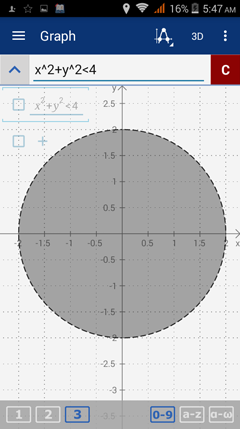
2. x2 + y2 < 4
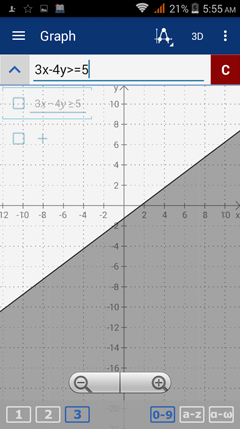
3. 3x - 4y ≥ 5
4. |2x - 4| ≥ y
| 5. y ≥ | x+2 |
| x-3 |
Calculator solutions
Type the greater than sign ( > ) by tapping the closed parentheses " ) " three times.
Type the less than sign ( < ) by tapping the open parentheses " ( " three times.
Use the variable y by tapping the x variable key twice.
1) Enter the expression: y > 2x - 1.
The solution is the half-plane with a shaded region above the dashed line y = 2x– 1.
2) Enter the expression: x^2 + y^2 < 4.
The solution includes all points inside the circle that do not lie on the curve of the circle itself as indicated by a dashed line.
The solution includes all points inside the circle that do not lie on the curve of the circle itself as indicated by a dashed line.
3) Enter the expression: 3x - 4y > 5 as "3x - 4y >= 5."
The solution is a half-plane with a shaded region below the solid line 3x – 4y = 5.
The solution is a half-plane with a shaded region below the solid line 3x – 4y = 5.
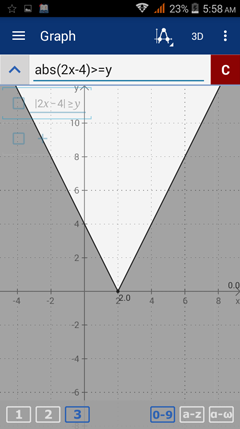
4) Enter the expression: |2x - 4| > y as "|2x - 4| >= y" by using the absolute value key |x|.
The solution is the shaded region outside the graph of the inequality that includes the points that lie on the curve of the absolute value equation.
The solution is the shaded region outside the graph of the inequality that includes the points that lie on the curve of the absolute value equation.
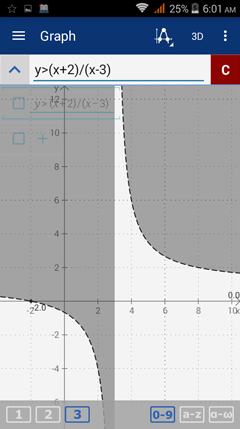
5) Enter the expression: y > (x + 2)/(x - 3) as "y >= (x + 2)/(x - 3)."
The solution includes two half-planes, one bounded by the lower curve and the line x = 3 and the other bounded by x = 3 and the upper curve.
The solution includes two half-planes, one bounded by the lower curve and the line x = 3 and the other bounded by x = 3 and the upper curve.

