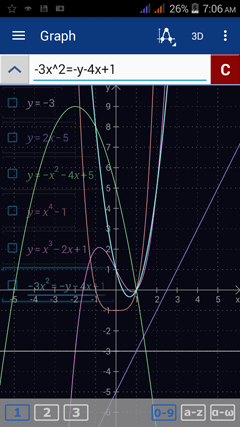
11.13. Multiple Graphing
Compare multiple graphs by sketching their functions in the same Graph workspace. Enter one equation per line by using the enter key. The font color of the graph in the top left corresponds to the color of its curve.
Example
Graph the following functions on the same coordinate plane:
Example
Graph the following functions on the same coordinate plane:
1. y = - 3
2. y = 2x – 5
3. y = -x2 – 4x + 5
4. y = x4 – 1
5. y = x3 – 2x + 1
6. -3x6 = –y – 4x + 1
2. y = 2x – 5
3. y = -x2 – 4x + 5
4. y = x4 – 1
5. y = x3 – 2x + 1
6. -3x6 = –y – 4x + 1
Calculator solutions
Enter each expression with one expression per line. If it is written as "y =," you only need to type the expression after y =. Use the exponent key x^n to enter an exponent. Type the variable y by tapping the x variable key twice.
1) Type: -3
2) Type: 2x - 5
3) Type: -x^2 - 4x + 5
4) Type: x^4 - 1
5) Type: x^3 - 2x + 1
6) Type the enter equation: -3x^6 = -y -4x + 1


