19.8.2. Correlation Coefficient
While covariance measures how two variables change together, it does not tell us the strength of the relationship. Correlation, on the other hand, standardizes how two variables change with respect to one another and measures the strength and direction of the relationship between the two variables. The correlation coefficient r ranges from -1 to 1, which are perfectly negative and perfectly positive correlations respectively.
To calculate the correlation coefficient, we divide cov(X, Y) by the product of the standard deviation of X and the standard deviation of Y. The equation is as follows:
To calculate the correlation coefficient, we divide cov(X, Y) by the product of the standard deviation of X and the standard deviation of Y. The equation is as follows:
Calculating the Correlation Coefficient
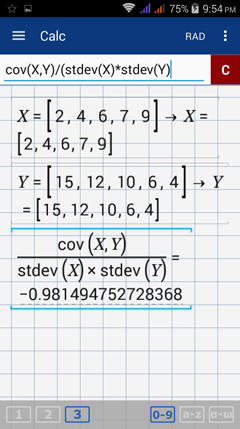
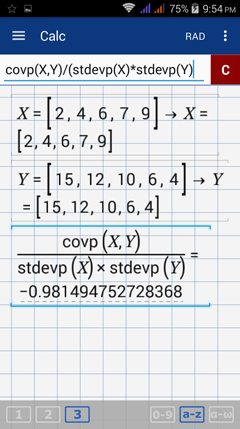
Since we already know how to calculate the covariance and standard deviation, to find the correlation coefficient, we use the syntax:
a) cov (X, Y) / (stdev (X) * stdev (Y) for a sample data set
b) covp (X, Y) / (stdevp (X) * stdevp (Y) for a population data set
The syntax is based on the formula above.
Illustrative Example
Determine whether a linear relationship exists between X and Y.
Calculate the correlation coefficient, r, and interpret its value.
X Y
2 15
4 12
6 10
7 6
9 4
Calculator solution
1) Enter each data set as a matrix.
X = [2, 4, 6, 7, 9]
Y = [15, 12, 10, 6, 4]
2) If the data set represents a sample, use the command: cov (X, Y) / (stdev (X) * stdev (Y).
If the data set represents a population, use the command: covp (X, Y) / (stdevp (X) * stdevp (Y).
The negative value of r implies an inverse relationship between X and Y. That is, as X increases, Y decreases. Since r is very close to -1, the relationship between X and Y is strongly negative.
CORR and CORRP Keys
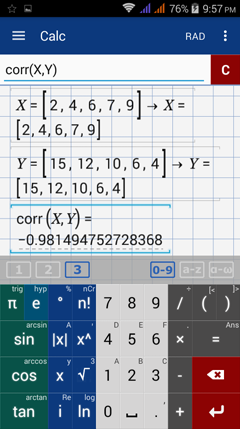
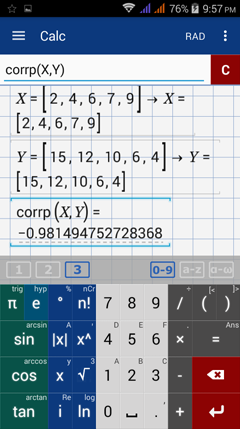
Although you can find the correlation through the cov, stdev and stdevp functions, you can take a shortcut by using corr. To use this function, hold the factorial (n!) and select corr or corrp. "corr" is used to find the correlation coefficient of a sample while "corrp" is used for a population.
To calculate correlation, use the following steps:
1) Enter the data sets in matrix form. Enter the values for X in one matrix and the values of Y in another matrix.
Use different names for these matrices, X and Y for example.
X = [2, 4, 6, 7, 9]
Y = [15, 12, 10, 6, 4]
2) Hold the factorial (n!) key and select corr if the data set represents a sample or corrp if it is a population.
3) Enter the matrices in this order: corr (X, Y) or corrp (X, Y).
Example
Using the same data set, find the correlation using the corr or corrp functions depending on which is appropriate.
Interpret the value of r.
X = [2, 4, 6, 7, 9]
Y = [15, 12, 10, 6, 4]


