Get it on Google Play
Graphing Calculator by Mathlab: User Manual
Get it on Google Play
  • Home
    • Introduction
    • PRO Features vs. FREE Version
    • Frequently Asked Questions, FAQs >
      • 1. How to Change the Number Format?
      • 2. How to Set Up the Separators Between Thousands?
      • 3. How to Set Precision?
      • 4. How to Send Feedback with Comments?
      • 5. How to import/export the library?
      • 6. How to Print Results?
      • 7. How to Make the Calculator Show the Results?
      • 8. How to Transport Calculation Results to other Programs?
      • 9. How to Transport Table to Other Platforms?
      • 10. How to Turn Off (or on) Vibration?
      • 11. How to Change the Language?
  • 1. Basics
    • 1.1. Navigation
    • 1.2. UI Elements
    • 1.3. Keyboard
    • 1.4. Input, Enter, Delete, Clear and UNDO Buttons
    • 1.5. Workspace Area
    • 1.6. Editing the Expression/Equation
    • 1.7. Using the Last Answer
    • 1.8. Writing Comments
    • 1.9. Clear, Copy & Paste Commands
    • 1.10. Rearranging Rows
  • 2. Settings
    • 2.1. General
    • 2.2. Calculator
    • 2.3. Graph
  • 3. Library
    • 3.1. Constants
    • 3.2. Functions
    • 3.3. How to Save Calculation Result/Graph to Library?
  • 4. Graph Mode
    • 4.1. 2D Graphing
    • 4.2. 3D Graphing
    • 4.3. Enlarging the Graph Area
    • 4.4. Changing to White Background
    • 4.5. Hide Keyboard
    • 4.6. Degree and Radian Scales
    • 4.7. Fixed Scale
    • 4.8. R-axis Scale
    • 4.9. Logarithmic Scale
    • 4.10. Tracing Values and Slopes
    • 4.11. Special Points: Roots and Criticals
    • 4.12. Intersections of Graphs
    • 4.13. Set Domain
    • 4.14. Show All - Roots, Critical Points and Intersections
    • 4.15. Fullscreen
  • 5. Table Mode
    • 5.1. Sharing of Functions
    • 5.2. 2D Table
    • 5.3. 3D Table
    • 5.4. Edit Functions
    • 5.5. Scroll Results
    • 5.6. Results Precision
    • 5.7. Zoom Controls
    • 5.8. Save and Load Table
    • 5.9. Table of Trigonometric Functions
  • 6. Numbers and Number Sense
    • 6.1. Decimals
    • 6.2. Fractions >
      • 6.2.1. Mixed Fractions
      • 6.2.2. Complex Fractions
      • 6.2.3. Converting Decimals to Fractions
      • 6.2.4. Converting Fractions to Decimals
    • 6.3. Percents
    • 6.4. Scientific Notation
    • 6.5. Engineering Notation
    • 6.6. Rounding Numbers
    • 6.7. Integer and Fractional Parts >
      • 6.7.1. Integer Part of a Number >
        • 6.7.1.1. Ceiling
        • 6.7.1.2. Floor
        • 6.7.1.3. Half Down
        • 6.7.1.4. Half to Even
        • 6.7.1.5. Half to Infinity
        • 6.7.1.6. Half to Odd
        • 6.7.1.7. Half to Zero
        • 6.7.1.8. Half Up
        • 6.7.1.9. Truncate
      • 6.7.2. Greatest Integer is the Floor Function
      • 6.7.3. Least Integer is the Ceiling Function
      • 6.7.4. Fractional Part of a Number
    • 6.8. Order of Operations
    • 6.9. Least Common Multiple
    • 6.10. Greatest Common Divisor
    • 6.11. Modulo
    • 6.12. Binary, Octal, Decimal, Hexadecimal Numbers
    • 6.13. Complex Numbers
    • 6.14. The Polar Form of Complex Numbers
    • 6.15. Polar to Rectangular Coordinates
  • 7. Introductory Algebra
    • 7.1. Arithmetic Operations
    • 7.2. Exponents
    • 7.3. Absolute Values
    • 7.4. Variables
    • 7.5. Evaluating Expressions
    • 7.6. Polynomials
    • 7.7. Roots
    • 7.8. Logarithms
  • 8. Equations in One Variable
    • 8.1. Linear Equation
    • 8.2. Absolute Value Equation
    • 8.3. Quadratic Equation
    • 8.4. Cubic Equation
    • 8.5. Polynomial Equation
    • 8.6. Rational Equation
    • 8.7. Radical Equation
    • 8.8. Exponential Equation
    • 8.9. Logarithmic Equation
  • 9. Inequalities in One Variable
    • 9.1. Inequality Symbols
    • 9.2. Linear Inequalities
    • 9.3. Absolute Value Inequalities
    • 9.4. Quadratic Inequality
    • 9.5. Polynomial Inequalities
    • 9.6. Rational Inequalities
    • 9.7. Compound Inequalities
    • 9.8. Inequalities with Constants
  • 10. Equations and Inequalities in Two Variables
    • 10.1. Linear Equations
    • 10.2. Systems of Linear Equations
    • 10.3. Graphing Inequalities
    • 10.4. Multiple Graphing of Inequalities
    • 10.5. Graphing Systems of Inequalities
    • 10.6. Solving Implicit Equations
  • 11. Algebraic Functions and Graphs
    • 11.1. Plotting Points
    • 11.2. How to Graph Functions?
    • 11.3. Setting the Applied Domain
    • 11.4. Linear Function
    • 11.5. Absolute Value Function
    • 11.6. Quadratic Function
    • 11.7. Polynomial Functions
    • 11.8. Rational Functions
    • 11.9. Radical Functions
    • 11.10. Logarithmic Functions
    • 11.11. Exponential Functions
    • 11.12. Sign Function
    • 11.13. Multiple Graphing
    • 11.14. Piecewise Functions
  • 12. Matrices and Vectors
    • 12.1. Matrix Operations
    • 12.2. Editing Matrix Entries
    • 12.3. Matrix Variables
    • 12.4. Matrix and Vector Forms
    • 12.5. Variable Matrix to System of Linear Equations
    • 12.6. Solving Systems of Linear Equations Using Matrix Equations
  • 13. Trigonometric Functions and Their Inverses
    • 13.1. Degrees and Radians >
      • 13.1.1. Degrees, Minutes and Seconds
      • 13.1.2. Bradis Table
    • 13.2. Trigonometric Function Keys
    • 13.3. Trigonometric Values of Special Angles >
      • 13.3.1. The 45- 45 - 90 Triangle
      • 13.3.2. The 30-60-90 Triangle
      • 13.3.3. Quadrantal Angles
      • 13.3.4. Coterminal Angles
    • 13.4. Trigonometric Values of 15 Degrees and Its Multiples
    • 13.5. Hyperbolic Function Keys
    • 13.6. Graphing Trigonometric Functions
    • 13.7. Graphing Hyperbolic Functions
    • 13.8. Graphing Inverse Functions
  • 14. Analytic Geometry
    • 14.1. Conic Sections
    • 14.2. Parametric Equations
    • 14.3. Polar Graphs >
      • 14.3.1. Limacon
      • 14.3.2. Cardioid
      • 14.3.3. Lemniscate
      • 14.3.4. Rose
      • 14.3.5. Other Polar Graphs
    • 14.4. 3D Graphing
  • 15. Limits
    • 15.1. Right - hand Limit
    • 15.2. Left - hand Limit
    • 15.3. Limit of a Function
    • 15.4. Limit of a Polynomial Function
    • 15.5. Limit of a Rational Function
    • 15.6. Limit of a Radical Function
    • 15.7. Limit of an Absolute Value Function
    • 15.8. Limit of a Trigonometric Function
    • 15.9. Limit of an Exponential and Logarithmic Function
    • 15.10. Limit of a Piece-wise Function
    • 15.11. Limits at Infinity
    • 15.12. Indeterminate Forms
    • 15.13. Limit of a Hyperbolic Function
  • 16. Derivatives
    • 16.1. First Derivative Key
    • 16.2. Second Derivative Key
    • 16.3. Third and Higher Derivative Keys
    • 16.4. Rules of Differentiation
    • 16.5. Derivatives of Polynomial Functions
    • 16.6. Derivatives of Rational Functions
    • 16.7. Dervatives of Trigonometric, Logarithmic and and Exponential Functions
    • 16.8. More on Derivatives
  • 17. Partial Derivatives
    • 17.1. Increments
    • 17.2. Dervative of a Function df (or dy))
    • 17.3. Derivative of a Function df (f not in terms of x)
    • 17.4. Other Partial Derivatives
    • 17.5. Higher Order Partial Derivatives
    • 17.6. Total Derivates
  • 18. Definite Integral
    • 18.1. Definite Integral of Algebraic Functions
    • 18.2. Definite Integral of Trigonometric Functions
  • 19. Basic Statistics
    • 19.1. Summation Notation
    • 19.2. Product Notation
    • 19.3. Minimum and Maximum
    • 19.4. Factorial, nCr and nPr
    • 19.5. Measures of Central Tendency >
      • 19.5.1. Mean from Ungrouped Data Set
      • 19.5.2. Mean from Frequency Distribution Table
      • 19.5.3. Median from Ungrouped Data Set
      • 19.5.4. Mode
    • 19.6. Measures of Variability >
      • 19.6.1. Range
      • 19.6.2. Interquartile Range and Quartile Deviation
      • 19.6.3. Mean Absolute Deviation
      • 19.6.4. Variance and Standard Deviation
      • 19.6.5. Coefficient of Variation
    • 19.7. Measures of Position
    • 19.8. Bivariate Data Analysis >
      • 19.8.1 Covariance
      • 19.8.2. Correlation Coefficient
      • 19.8.3. Scatter Plot and Regression Line
  • 20. Special Functions
    • 20.1. Gamma Function
    • 20.2. Logarithmic Gamma Function
    • 20.3. Digamma Function
  • 21. List of ALL Functions
    • 21.1. Arithmetics
    • 21.2. Algebra
    • 21.3. Trigonometry
    • 21.4. Statistics
    • 21.5. Calculus

15.10. Limit of a Piecewise Function

A piecewise function behaves differently in different intervals of its domains. One example of a piecewise function is the absolute value function. An absolute value function increases when x > 0 and is equal to x. It also increases when x < 0 and is equal to -x.
Due to the nature of piecewise functions, the graph of f(x) may have discontinuities. There are multiple cases for finding the limit of a piecewise function. If x = c is inside an interval but is not a restricted value, the limit is f(c). If x = c is at a restricted value or where the function changes behaviors, consider both left- and right-hand limits.
Illustrative Example
Refer to the given function f(x) to evaluate each limit.
​Solutions
Calculator solution
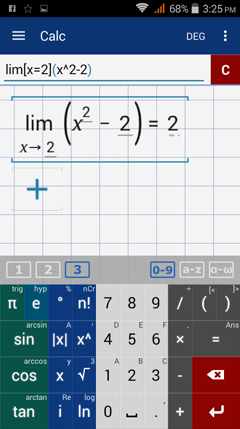
​Since x = 2 is in the interval x > 0, plug 2 into f(x) = x^2 - 2. The limit is f(2) = 2^2 - 2 = 2.
Type in: lim [ x = 2 ] ( x^2 - 2 )
Picture
Calculator solution
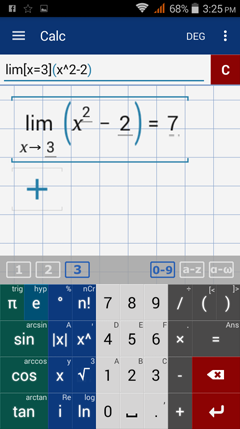
Since x = 3 is in the interval x > 0, plug it into the function f(x) = x^2 ​- 2. The limit is f(3) = 3^2 - 2 = 7.
Type in: lim [ x = 3 ] ( x^2 - 2 )
Picture
Calculator solution
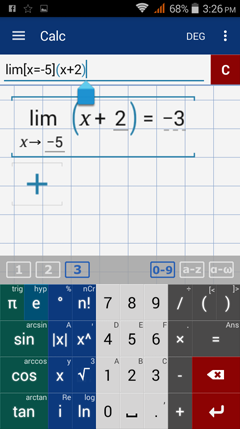
Since x = -5 is in the interval x < 0, plug in -5 into the function f(x) = x + 2. The limit is f(-5) = -5 + 2 = -3.
Type in: lim [ x = -5 ] ( x + 2 )
Picture
Calculator solution
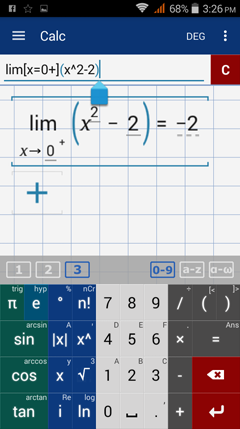
​Although the function changes behavior around 0, we are looking for the right-hand limit. Because x approaches 0 from the right, we plug 0 into the function f(x) = x^2 - 2. The limit is f(0) = 0^2 - 2 = -2.
Type in: lim [ x = 0 + ] ( x^2 - 2 )
Picture
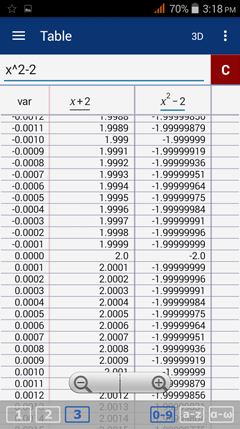
Because the function changes behavior around 0, we have to consider the left- and right-hand limits.

Solution 1: Table 

x         -0.01        -0.001       -0.001       -0.0001      -0.00001         0          0.00001              0.0001                0.001           0.01
f(x)      1.99            1.999         1.9999        1.99999        1.999999         2       -1.999999999    -1.99999999       -1.999999    -1.9999

Since f(x) approaches 2 from the left and -2 from the right, the limit of f(x) does not exist.
Picture

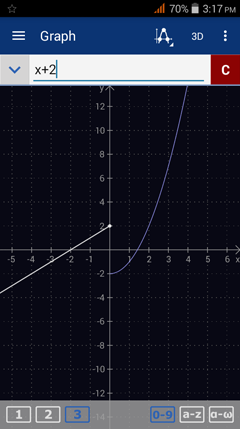
​Solution 2: Graphing

Sketch the graph of f(x). Because the graph has a jump discontinuity at x = 0, the limit as x approaches 0 does not exist.
Picture
next: 15.11. limits at infinity >
list of contents
Powered by Create your own unique website with customizable templates.