11.1. Plotting Points
1) Open Graph mode. Then, click the gray button on the left side of the input field.
If you click it once, it shows a list of functions for plotting graphs, clicking it again hides the list.
If you click it once, it shows a list of functions for plotting graphs, clicking it again hides the list.
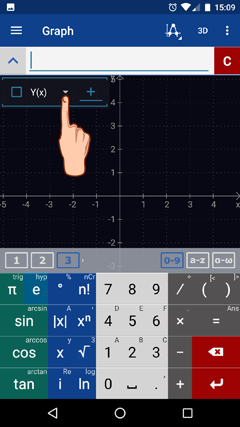
2) Click the same gray button to see the scroll-down menu. Previously entered functions appear on the screen.
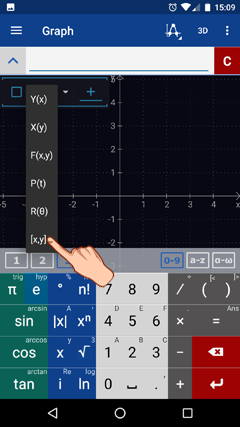
Click on the small triangle to the right of the new function to see the scroll-down menu.
Click on the small triangle to the right of the new function to see the scroll-down menu.
3) Select [x, y] to plot points with x and y coordinates.
4) Click the gray button on the right side of the input field.
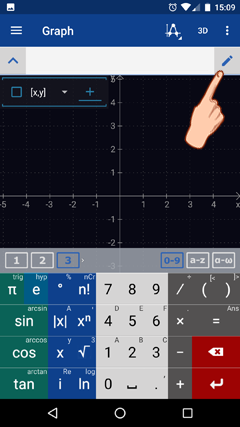
5) Tap the screen where the pointing finger shows. The line should turn light-blue. Then, enter the value of x.
6) Tap the screen where the pointing finger shows. The line should turn light-blue. Then, enter the value of y.
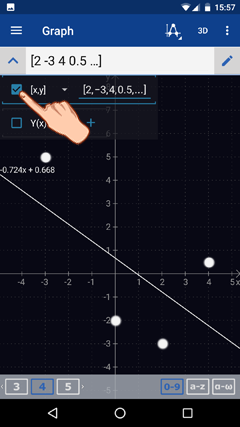
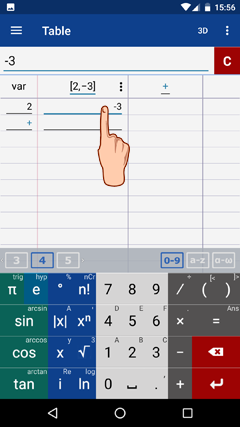
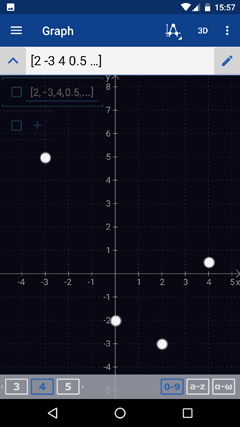
So the first row shows the coordinates of the point [2 -3].
So the first row shows the coordinates of the point [2 -3].
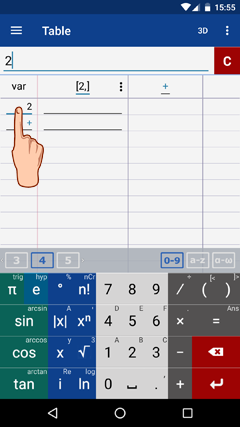
7) You can continue to enter coordinates in as many rows as needed.
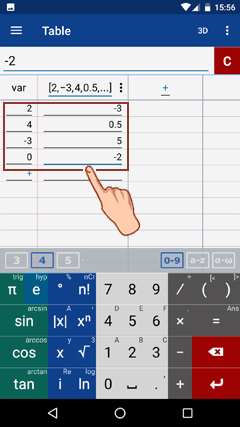
This table shows coordinates of 4 points [2 -3], [4 0.5], [-3 5], and [0 -2].
This table shows coordinates of 4 points [2 -3], [4 0.5], [-3 5], and [0 -2].
8) Use the main menu to switch to the graph mode to see points on the graph.
9) To add the trend line for the set of points, tap the square to the left of the coordinates enclosed in brackets. The trend line and its equations automatically appear on the screen.