19.5.2. Mean from Frequency Distribution Table
The mean of a grouped data set as presented in a frequency distribution table can be found by summing the products of the data point's value and the frequency of the value:
The mean of a grouped data set as presented in a frequency distribution table can be found by summing the products of the data point's value and the frequency of the value:
Given a data set:
Classes Frequency
10 < 20 5
20 < 30 4
30 < 40 10
40 < 50 1
50 < 60 5
1) Find the class mark of each interval by taking the average of the upper and lower limits.
For example, the class mark of the interval 10 < 20 is (20+10)/2 = 15.
2) Find the product of the class mark and frequency for each interval to get:
Classes Frequency Product
10 < 20 5 15 × 5
20 < 30 4 25 × 4
30 < 40 10 35 × 10
40 < 50 1 45 × 1
50 < 60 5 55 × 5
3) Enter the data points using matrices.
Enter the products in one matrix and the frequencies in another matrix.
Example:
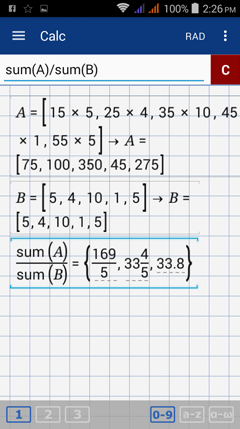
A = [15 × 5, 25 × 4, 35 × 10, 45 × 1, 55 × 5]
B = [4, 5, 10, 1, 5 ]
4) Note that the mean of a grouped data set is calculated by dividing the sum of the products for each interval by the sum of the frequencies. Use the sum function to find the average by entering sum(A)/sum(B).
Example
The monthly salaries of 20 selected employees at a company are listed in the frequency distribution table below. What is the average monthly salary of these employees?
Salary (in $1000) No. of Employees
2 < 6 8
6 < 10 5
10 < 14 4
14 < 18 2
18 < 22 1
Solution
1) Find the class mark of each interval.
Salaries (in $1000) No. of Employees Class mark
2 < 6 8 4
6 < 10 5 8
10 < 14 4 12
14 < 18 2 16
18 < 22 1 20
2) Enter the products of the class mark and number of employees (frequency) in matrix form.
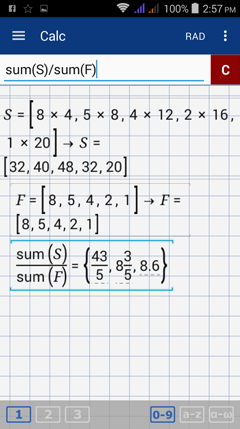
S = [8 × 4, 5 × 8, 4 × 12, 2 × 16, 1 × 20]
3) Enter the frequencies in matrix form.
F = [8, 5, 4, 2, 1]
4) Find the average by entering sum (S)/sum (F).


