19.5.1. Mean of an Ungrouped Data Set
To find the mean (or average) of an ungrouped data set where the data is not presented in intervals, find the sum of all the data points and divide it by the number of observations as shown below:
To find the mean (or average) of an ungrouped data set where the data is not presented in intervals, find the sum of all the data points and divide it by the number of observations as shown below:
|
|
or |
|
where
x̅ - sample mean μ - population mean x - sample data point X - population data point n - number of observations N - population size |
Difference between Grouped and Ungrouped Data Sets
Consider the three data sets below.
Data set 1: 4, 5, 6, 8, 9, 10
Data set 2:
Classes Frequency
10 < 20 5
20 < 30 4
30 < 40 10
40 < 50 1
50 < 60 5
Data set 3:
X Frequency
12 4
10 3
8 12
6 6
4 5
The first data set is an example of an ungrouped data set while sets 2 and 3 are grouped data sets.
Calculating the Mean of an Ungrouped Data Set
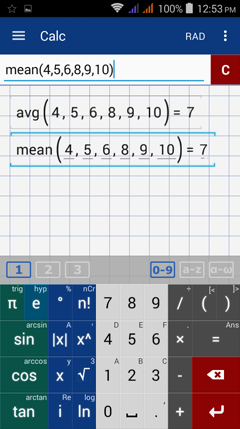
To find the mean of Data Set 1, add 4 + 5 + 6 + 8 + 9 + 10 and divide by 6 (since there are 6 data points). The sum is 42/6 = 7.
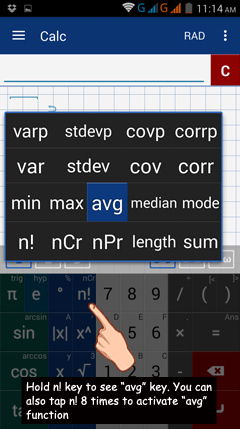
To find the mean using the calculator, type avg (4, 5, 6, 8, 9, 10) or mean(4, 5, 6, 8, 9, 10). The calculator displays 7 using both methods. You can also use the avg function found under the factorial key (n!). Enter the data set in parentheses and separate data points using a comma.
Consider the three data sets below.
Data set 1: 4, 5, 6, 8, 9, 10
Data set 2:
Classes Frequency
10 < 20 5
20 < 30 4
30 < 40 10
40 < 50 1
50 < 60 5
Data set 3:
X Frequency
12 4
10 3
8 12
6 6
4 5
The first data set is an example of an ungrouped data set while sets 2 and 3 are grouped data sets.
Calculating the Mean of an Ungrouped Data Set
To find the mean of Data Set 1, add 4 + 5 + 6 + 8 + 9 + 10 and divide by 6 (since there are 6 data points). The sum is 42/6 = 7.
To find the mean using the calculator, type avg (4, 5, 6, 8, 9, 10) or mean(4, 5, 6, 8, 9, 10). The calculator displays 7 using both methods. You can also use the avg function found under the factorial key (n!). Enter the data set in parentheses and separate data points using a comma.
Examples
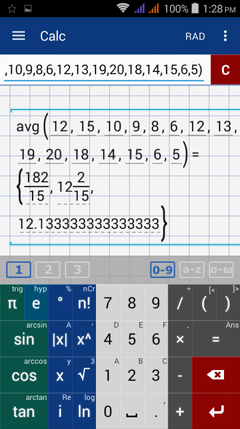
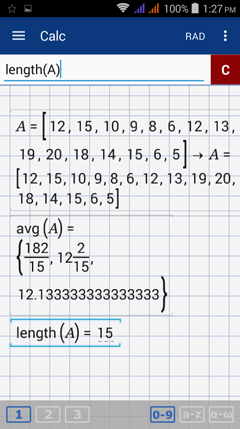
1) The test scores (out of 20 points) of 15 students in a Statistics class are: 12, 15, 10, 9, 8, 6, 12, 13, 19, 20, 18, 14, 15, 6, 5.
What is the average test score?
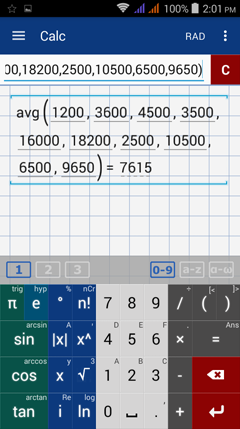
2) The starting monthly salaries of 10 employees at a certain company are listed below.
$1200, $3600, $4500, $3500, $16000, $ 18200, $2500, $10500, $6500, $9650
What is the average starting salary of these employees?
Calculator Solutions
1) Hold the factorial key (n!) and select avg or type "avg" using the a-z keyboard.
Then type the following: 12, 15, 10, 9, 8, 6, 12, 13, 19, 20, 18, 14, 15, 6, 5
1) The test scores (out of 20 points) of 15 students in a Statistics class are: 12, 15, 10, 9, 8, 6, 12, 13, 19, 20, 18, 14, 15, 6, 5.
What is the average test score?
2) The starting monthly salaries of 10 employees at a certain company are listed below.
$1200, $3600, $4500, $3500, $16000, $ 18200, $2500, $10500, $6500, $9650
What is the average starting salary of these employees?
Calculator Solutions
1) Hold the factorial key (n!) and select avg or type "avg" using the a-z keyboard.
Then type the following: 12, 15, 10, 9, 8, 6, 12, 13, 19, 20, 18, 14, 15, 6, 5
Note: if you want to use the same data set again, you can enter it in matrix form using brackets and assign it a name. For example, if you want to fight the length or number of observations, you can name the data set as matrix A. To find the mean, use the command "avg (A)." To find the length, use "length (A)."
2) Find the average: $1200, $3600, $4500, $3500, $16000, $ 18200, $2500, $10500, $6500, $9650
Hold the factorial key (n!) and select avg or type "avg" using the a-z keyboard.
Then type the following: 1200, 3600, 4500, 3500, 16000, 18200, 2500, 10500, 6500, 9650