5.2. 2D Table
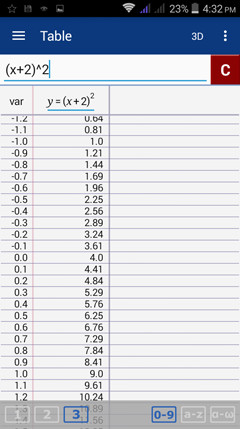
Functions graphed in the 2D graphing window will have a two-column table: one column for the independent variable and another for the dependent variable.
Example
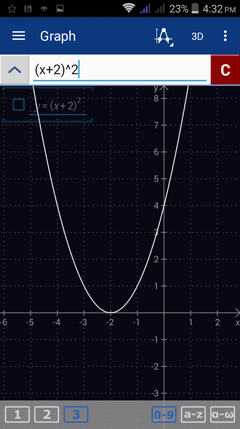
The equation y = (x + 2)^2 is a 2D graph of a parabola. To see its table of values, tap the menu button and choose Table.
Example
The equation y = (x + 2)^2 is a 2D graph of a parabola. To see its table of values, tap the menu button and choose Table.
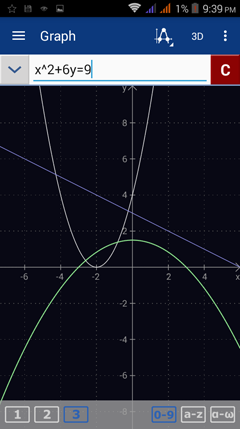
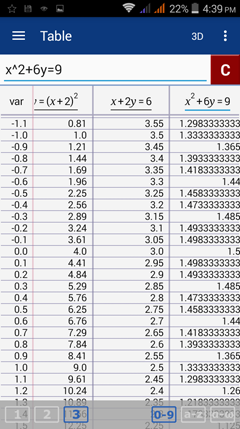
If another equations are graphed simultaneously in the same 2D workspace, the graphs' x and y values will also appear in the same table. To see the shared table, tap the menu button and select Table.


