5.3. 3D Table
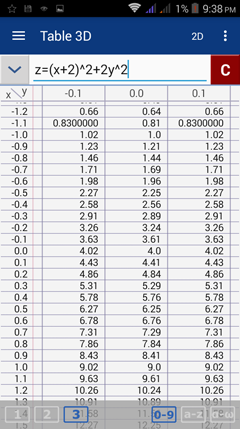
Equations graphed in the 3D graph window will have a 3D table with three columns: two columns for the independent variables (x and y) and one column for the dependent variable (z).
Example
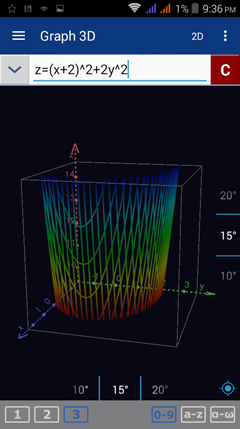
The equation z = (x + 2)^2 + 2y^2 is a 3D graph of a quadric surface and its x, y and z values can be seen in the Table Mode. To see the table of values, tap the menu button and select table.
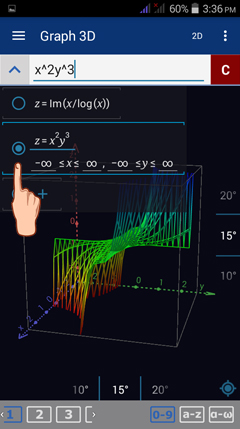
Unlike the 2D graph window, the 3D graph window doesn't allow simultaneous graphing so one table of values is shown at a time. However, you can still enter one equation per row into the input field. To select which graph to view, just tap the arrow-up button on the leftmost part of the input field. Tap the equation you want its graph to be displayed.
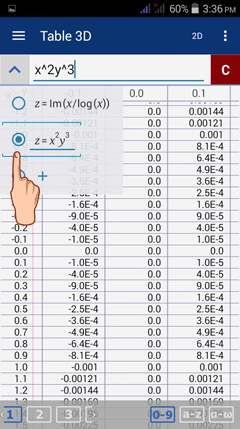
Likewise, to select which table to view, just tap the arrow-up button on the leftmost part of the input field. Tap the equation you want its table of values to be displayed.


