14.3. Polar Graphs
14.3. Polar Graphs
To graph a function in polar coordinates, enter it as a function of θ: r = f(θ). If you are graphing multiple functions, the first function determines whether the coordinate system is polar or cartesian.
The default range of θ is from 0 to 2π. You can change it by going to Settings > Graph > Polar Coordinates. You can also change the θ range for each graph individually by tapping the function and editing the start or terminal angle.
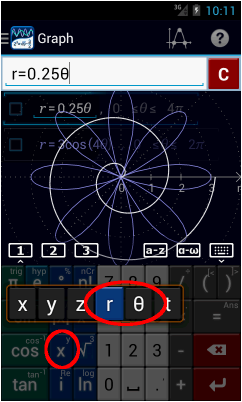
Note: You can select θ as a function under the variable key x, or you can enter θ using the Greek keyboard.
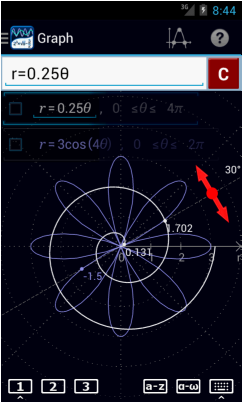
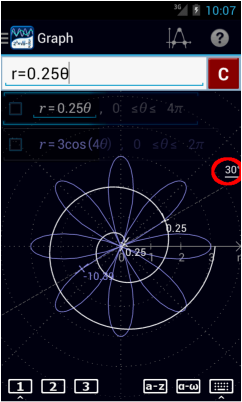
Tap the r-axis and drag the graph in a circle to trace function values. Tap the trace line to display function slopes. Tap it again to switch back to function values. Tap the r-axis to hide the trace line.


