19.3. Minimum and Maximum
The minimum of a given data set is the smallest data point while the maximum is the largest. To find the minimum, type min using the letter keys and write the data set as the argument in parentheses. Separate the data points using a comma. To find the maximum, type max before writing the data set in parentheses.
Examples
Find the minimum and maximum for each data set.
1) 2, 3, 6, -2, 0, 12
2) 4, 45, 10, -24, -30
3) 12, 45, -35, -50, 0
Calculator solutions
Find the maximum by typing "max" using the a-z keyboard, and find the minimum by typing "min." Separate the data points using a comma and enclose the data set in parentheses.
1) Type: max (2, 3, 6, -2, 0, 12). Hit enter.
min (2, 3, 6, -2, 0, 12)
2) Type: max (4, 45, 10, -24, -30). Hit enter.
min (4, 45, 10, -24, -30)
3) Type: max (12, 45, -35, -50, 0). Hit enter.
min (12, 45, -35, -50, 0)
Examples
Find the minimum and maximum for each data set.
1) 2, 3, 6, -2, 0, 12
2) 4, 45, 10, -24, -30
3) 12, 45, -35, -50, 0
Calculator solutions
Find the maximum by typing "max" using the a-z keyboard, and find the minimum by typing "min." Separate the data points using a comma and enclose the data set in parentheses.
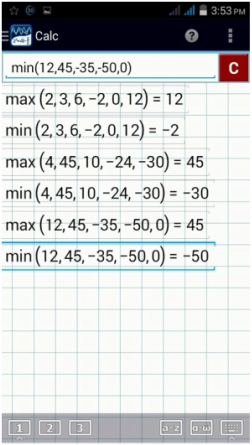
1) Type: max (2, 3, 6, -2, 0, 12). Hit enter.
min (2, 3, 6, -2, 0, 12)
2) Type: max (4, 45, 10, -24, -30). Hit enter.
min (4, 45, 10, -24, -30)
3) Type: max (12, 45, -35, -50, 0). Hit enter.
min (12, 45, -35, -50, 0)
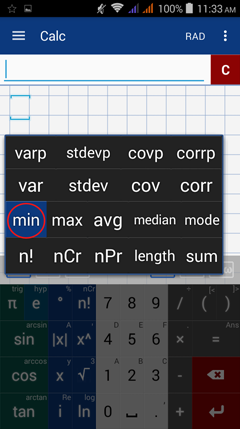
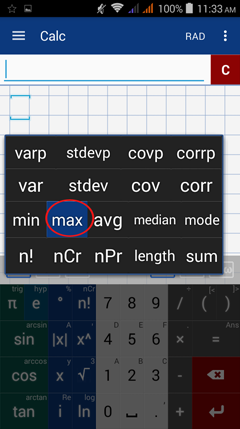
Min and Max Keys
You can also use the min and max keys listed under the factorial function (n!). Hold "n!" and select min or max. Alternatively, you can tap n! six times to use "min" and seven times to use "max." Enter the data set in parentheses.
Examples
Find the minimum and maximum for each data set.
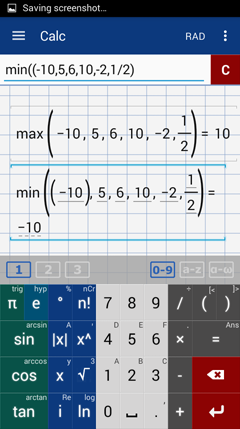
1) -10, 5, 6, 10, -2, 1/2
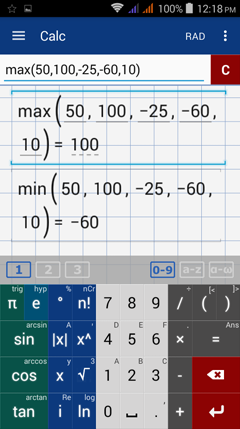
2) 50, 100, -25, -60, 10
3) 6, 1/3, 1/8, 5/6, -2/5, -2/3
Calculator solutions
1) -10, 5, 6, 10, -2, 1/2
Find the maximum value first.
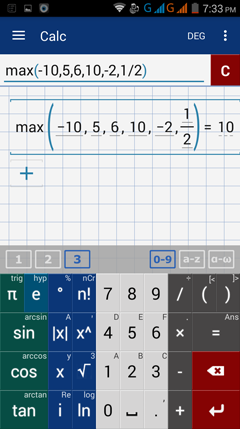
Hold the n! key and select max.
Type the following: -10, 5, 6, 10, -2, 1/2
Find the minimum and maximum for each data set.
1) -10, 5, 6, 10, -2, 1/2
2) 50, 100, -25, -60, 10
3) 6, 1/3, 1/8, 5/6, -2/5, -2/3
Calculator solutions
1) -10, 5, 6, 10, -2, 1/2
Find the maximum value first.
Hold the n! key and select max.
Type the following: -10, 5, 6, 10, -2, 1/2
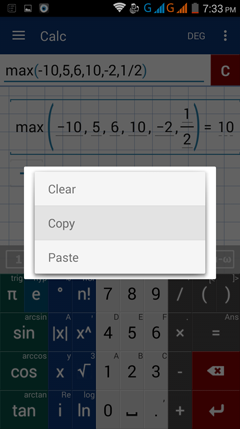
Note: Copy and paste the data set by using the copy-paste command.
Hold the input field and tap "select all." Then tap "copy" and hit enter.
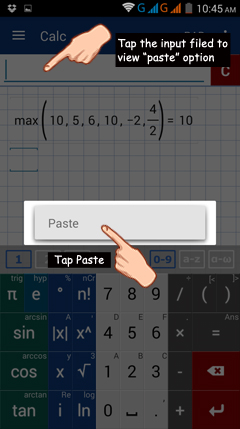
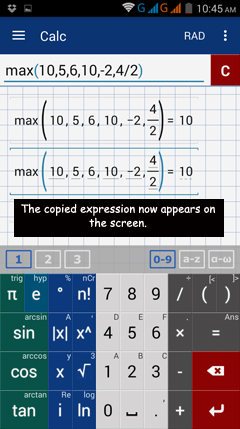
On a new line, hold the input field and select "paste."
Change "max" to "min" by either typing "min" or using the min button listed under n! (factorial key).
Hold the input field and tap "select all." Then tap "copy" and hit enter.
On a new line, hold the input field and select "paste."
Change "max" to "min" by either typing "min" or using the min button listed under n! (factorial key).
2) 50, 100, -25, -60, 10
Hold the n! key and select max.
Then type the following: 50, 100, -25, -60, 10
Hold the input field and select "copy." Hit enter.
On a new line, hold the input field and select "paste."
Change "max" to "min" by either typing the word min or using the min button listed under n! (factorial key).
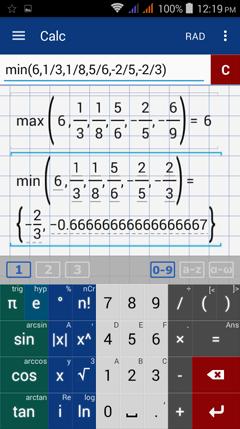
3) 6, 1/3, 1/8, 5/6, -2/5, -2/3
Hold the n! key and select max.
Then type the following: 6, 1/3, 1/8, 5/6, -2/5, -2/3
Hold the input field and select "copy." Hit enter.
On a new line, hold the input field and select "paste."
Change "max" to "min" by either typing the word min or using the min button listed under n! (factorial key).