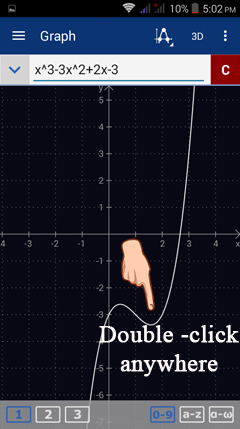
4.1. 2D Graphing
The App provides both 2D and 3D graphing windows. The default window is 2D. To graph an equation in 3D, tap the 3D icon in the upper right-hand corner of the screen. Tap it again to go back to 2D graphs.
The 2D graph window lets you sketch the graph of any function or equation defined in terms of x and y (although other pairs of variables work as well). If the equation is expressed in both x and y, type the entire equation as it appears.
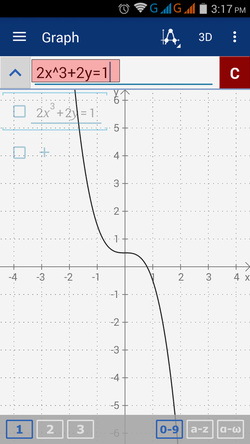
For example, to sketch the graph of 2x^3 + 2y = 1, enter "2x^3 + 2y = 1" into the input field as shown below:
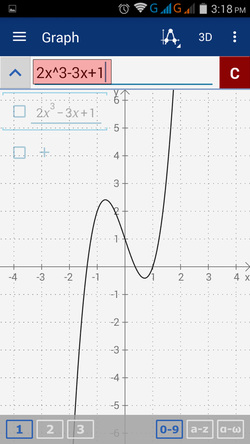
If the function is defined explicitly, such as f(x) = 2x^3 - 3x + 1, enter just the expression of the function: "2x^3 - 3x + 1."
Resizing Graphs
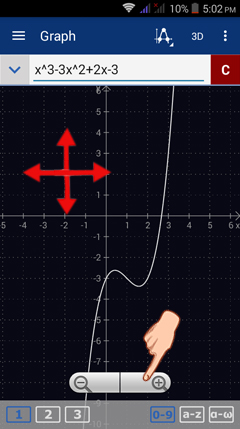
To resize the graph, pinch any part of the screen and stretch the graphing window. Alternatively, you can tap anywhere on the screen to view the zoom controls. Tapping the plus (+) will enlarge the graph and tapping the minus (-) will make the graph smaller.
To resize the graph, pinch any part of the screen and stretch the graphing window. Alternatively, you can tap anywhere on the screen to view the zoom controls. Tapping the plus (+) will enlarge the graph and tapping the minus (-) will make the graph smaller.
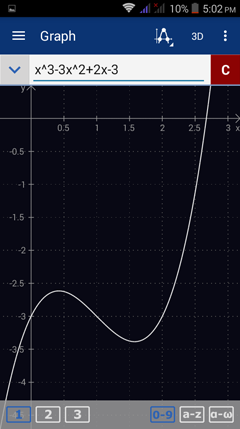
If you decide to see the graph in its original size again, double tap anywhere on the screen. The app will automatically display the original size of the graph as it was sketched.

