15.5. Limit of a Rational Function
Limit of a Rational Function
A rational function may have a restricted value at x = c such that finding the limit is not straightforward. The rules are listed as follows:
1) Determine the restricted values for the domain of the function.
To find these values, set the denominator to 0 and find the roots of the resulting equation.
Example
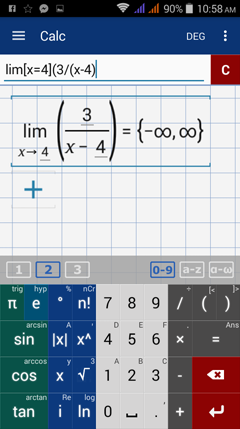
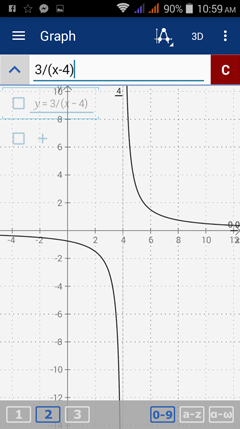
f(x) = 3/(x - 4)
When x = 4, the function is undefined, implying that the graph has an infinite discontinuity such that the limit does not exist as x approaches 4. The line x=4 is a vertical asymptote of the graph.
A rational function may have a restricted value at x = c such that finding the limit is not straightforward. The rules are listed as follows:
1) Determine the restricted values for the domain of the function.
To find these values, set the denominator to 0 and find the roots of the resulting equation.
Example
f(x) = 3/(x - 4)
When x = 4, the function is undefined, implying that the graph has an infinite discontinuity such that the limit does not exist as x approaches 4. The line x=4 is a vertical asymptote of the graph.
2) If c is a restricted value, the limit may or may not exist.To determine whether it exists, simplify the rational expression. The limit exists if the simplified form is no longer a rational expression or the denominator is no longer zero when x = c.
3) Plug in c after you simplify the expression. If the denominator is still zero, find the one-sided limits of the function by plugging in values that are close to c from the left and right. If the one-sided limits are equal, the limit equals the left- and right-hand limits. Otherwise the limit does not exist.
4) If c is not in the restricted domain, plug it into the rational expression as you usually would.
Finding the Limit Through Direct Substitution
In each rational function below, the value of c is not in the restricted domain so the limit can be found by plugging in the value of c.
Examples
Find the indicated limit.
In each rational function below, the value of c is not in the restricted domain so the limit can be found by plugging in the value of c.
Examples
Find the indicated limit.
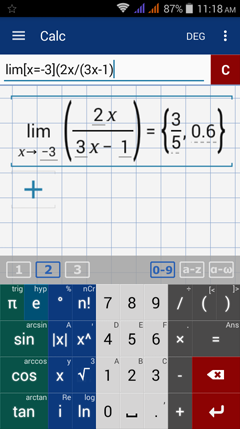
Calculator solution
Type in: lim [ x = -3 ] ( ( 2x ) / (3x - 1 ) )
Type in: lim [ x = -3 ] ( ( 2x ) / (3x - 1 ) )
Calculator solution
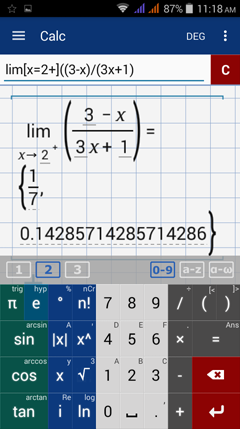
Type in: lim [ x = 2 + ] ( ( 3 - x ) / ( 3x + 1 ) )
Type in: lim [ x = 2 + ] ( ( 3 - x ) / ( 3x + 1 ) )
Calculator solution
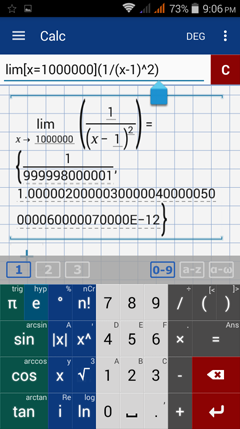
Type in: lim [ x = 1000000 ] ( 1 / ( x - 1 )^2 )
Type in: lim [ x = 1000000 ] ( 1 / ( x - 1 )^2 )
Calculator solution
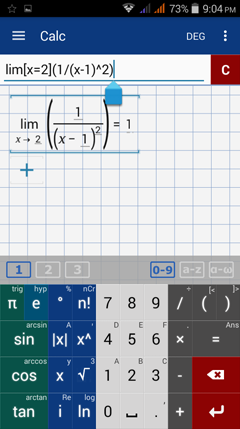
Type in: lim [ x = 2 ] ( 1 / ( x - 1 )^2 )
Type in: lim [ x = 2 ] ( 1 / ( x - 1 )^2 )
Limit at a Restricted Value of X
In each rational function below, the value of c is a restricted value of the function's domain. There are three cases that could happen:
Case 1: The Limit Exists
The limit exists at the restricted value if the original rational function can be simplified to cancel out the denominator. At x = c, the graph has a hole.
Illustrative Example
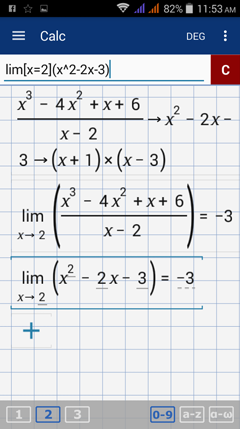
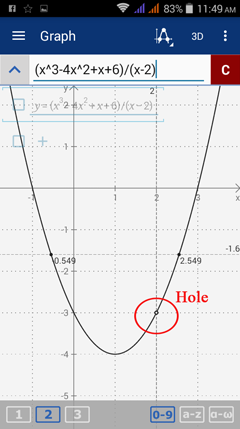
Consider the function f(x) = (x^3 - 4x^2 + x + 6) / (x - 2) and find the limit as x approaches 2. The function is undefined at x = 2, but the expression can be simplified to f(x) = x^2 - 2x - 3. Because the denominator cancels out, the limit as x approaches 2 exists.
Note that finding the limit of f(x) = (x^3 - 4x^2 + x + 6) / (x - 2) gives the same result as finding the limit of f(x) = x^2 - 2x - 3 as shown below.
In each rational function below, the value of c is a restricted value of the function's domain. There are three cases that could happen:
Case 1: The Limit Exists
The limit exists at the restricted value if the original rational function can be simplified to cancel out the denominator. At x = c, the graph has a hole.
Illustrative Example
Consider the function f(x) = (x^3 - 4x^2 + x + 6) / (x - 2) and find the limit as x approaches 2. The function is undefined at x = 2, but the expression can be simplified to f(x) = x^2 - 2x - 3. Because the denominator cancels out, the limit as x approaches 2 exists.
Note that finding the limit of f(x) = (x^3 - 4x^2 + x + 6) / (x - 2) gives the same result as finding the limit of f(x) = x^2 - 2x - 3 as shown below.
The graph below shows that the graph still has a hole at x = 2.
More Examples
Evaluate the limit of each rational function as x approaches c where c is a restricted value of the domain.
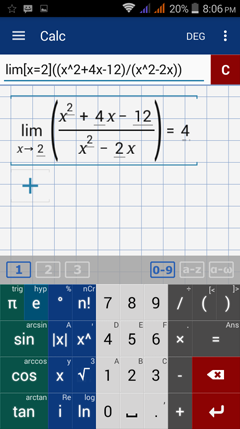
Calculator solution
Type in: lim [ x = 2 ] ( ( x^2 + 4x - 12 ) / ( x^2 - 2x ) )
Type in: lim [ x = 2 ] ( ( x^2 + 4x - 12 ) / ( x^2 - 2x ) )
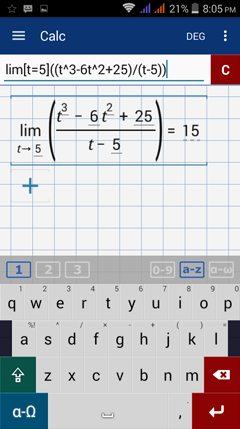
Calculator solution
Type in: lim [ t = 5 ] ( ( t^3 - 6t^2 + 25 ) / ( t - 5 ) )
Type in: lim [ t = 5 ] ( ( t^3 - 6t^2 + 25 ) / ( t - 5 ) )
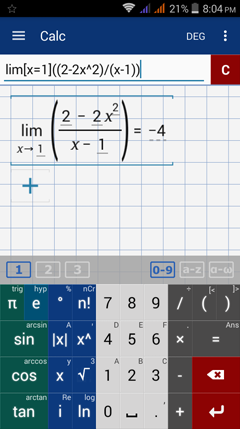
Calculator solution
Type in: lim [ x = 1 ] ( ( 2 - 2x^2 ) / ( x - 1 ) )
Type in: lim [ x = 1 ] ( ( 2 - 2x^2 ) / ( x - 1 ) )
Calculator solution
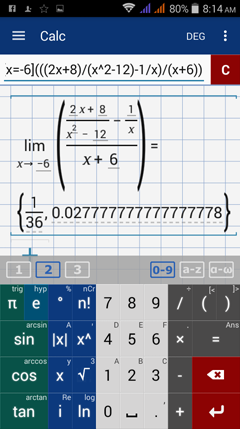
Type in: lim [ x = -6 ] ( ( ( 2x + 8 ) / ( x^2 - 12 ) - 1 / x ) / ( x + 6 ) )
Type in: lim [ x = -6 ] ( ( ( 2x + 8 ) / ( x^2 - 12 ) - 1 / x ) / ( x + 6 ) )
Calculator solution
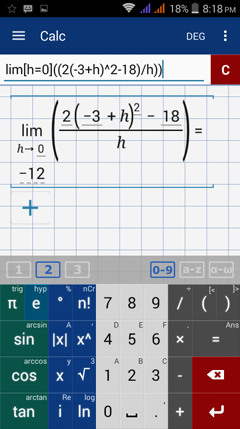
Type in: lim [ h = 0 ] ( ( 2 ( -3 + h )^2 - 18 ) / h )
Type in: lim [ h = 0 ] ( ( 2 ( -3 + h )^2 - 18 ) / h )
Calculator solution
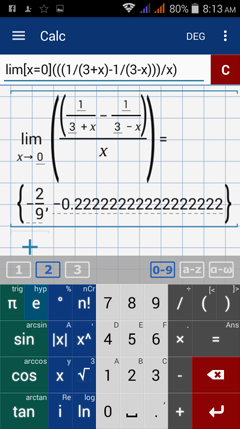
Type in: lim [ x = 0 ] ( ( ( 1 / ( 3 + x ) - 1 / ( 3 - x ) ) ) / x )
Type in: lim [ x = 0 ] ( ( ( 1 / ( 3 + x ) - 1 / ( 3 - x ) ) ) / x )
Case 2: Limit to Infinity
The limit may approach infinity if the denominator is still zero at x = c. As a result, the graph of the function continues increasing or decreasing as x approaches c from the left and right. At this value of x, the graph has an infinite discontinuity. The limit exists if the left- and right-hand limits increase or decrease in the same direction.
Illustrative Example
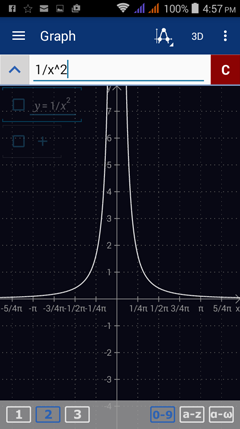
Consider the function f(x) = 1/x^2 and find the limit as x approaches 0. Because the denominator is zero when we plug in x = 0, we have to evaluate the function from the left and right. The left- and right-hand limits both approach positive infinity, so the limit of f(x) as x approaches 0 is ∞.
The limit may approach infinity if the denominator is still zero at x = c. As a result, the graph of the function continues increasing or decreasing as x approaches c from the left and right. At this value of x, the graph has an infinite discontinuity. The limit exists if the left- and right-hand limits increase or decrease in the same direction.
Illustrative Example
Consider the function f(x) = 1/x^2 and find the limit as x approaches 0. Because the denominator is zero when we plug in x = 0, we have to evaluate the function from the left and right. The left- and right-hand limits both approach positive infinity, so the limit of f(x) as x approaches 0 is ∞.

More Examples
Calculator solution
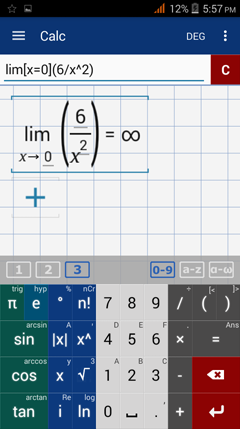
Type in: lim [ x = 0 ] ( 6 / x^2 )
Type in: lim [ x = 0 ] ( 6 / x^2 )
Calculator solution
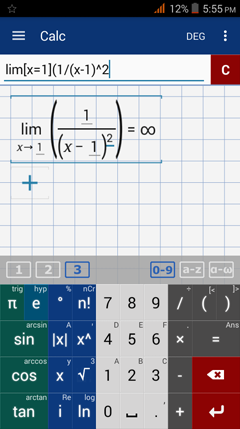
Type in: lim [ x = 1 ] ( 1 / ( x - 1 )^2 )
Type in: lim [ x = 1 ] ( 1 / ( x - 1 )^2 )
Calculator solution
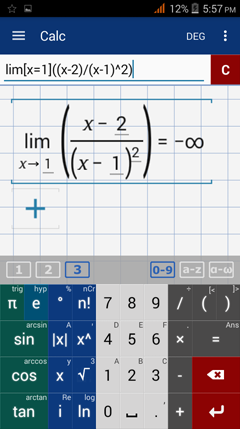
Type in: lim [ x = 1 ] ( ( x - 2 ) / ( x - 1 )^2 )
Type in: lim [ x = 1 ] ( ( x - 2 ) / ( x - 1 )^2 )
Calculator solution
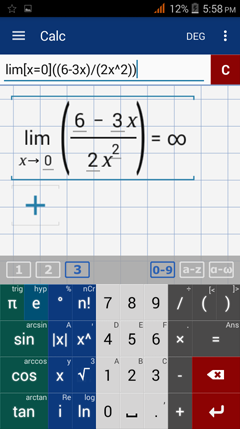
Type in: lim [ x = 0 ] ( ( 6 - 3x ) / ( 2x^2 ) )
Type in: lim [ x = 0 ] ( ( 6 - 3x ) / ( 2x^2 ) )
Calculator solution
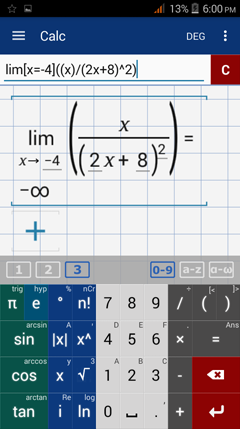
Type in: lim [ x = - 4 ] ( x / ( 2x + 8 )^2 )
Type in: lim [ x = - 4 ] ( x / ( 2x + 8 )^2 )
Case 3: The Limit Does Not Exist (DNE)
When the denominator is zero at x = c, x = c is a vertical asymptote of the graph. The function either continues increasing or decreasing as x approaches c from the left and right. If the left- and right-hand limits are in different directions, the limit does not exist.
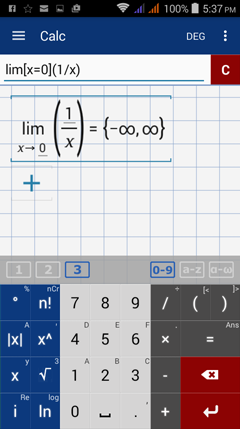
Illustrative Example
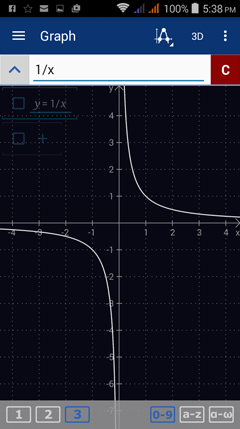
Consider the limit of f(x) = 1/x as x approaches 0. The function is undefined at x = 0, as shown below. Because the left-hand limit is negative infinity while the right-hand limit is positive infinity, the limit as x approaches 0 does not exist.
When the denominator is zero at x = c, x = c is a vertical asymptote of the graph. The function either continues increasing or decreasing as x approaches c from the left and right. If the left- and right-hand limits are in different directions, the limit does not exist.
Illustrative Example
Consider the limit of f(x) = 1/x as x approaches 0. The function is undefined at x = 0, as shown below. Because the left-hand limit is negative infinity while the right-hand limit is positive infinity, the limit as x approaches 0 does not exist.
More Examples
Calculator solution
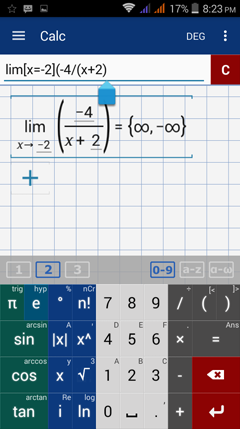
Type in: lim [ x = -2 ] ( -4 / ( x + 2 ) )
Type in: lim [ x = -2 ] ( -4 / ( x + 2 ) )
Calculator solution
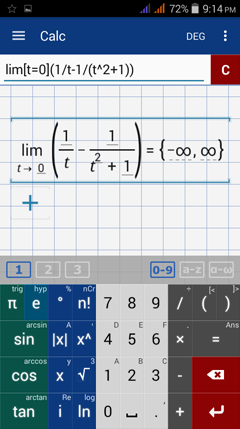
Type in: lim [ t = 0 ] ( 1 / t - 1 / ( t^2 + 1 ) )
Type in: lim [ t = 0 ] ( 1 / t - 1 / ( t^2 + 1 ) )
Calculator solution
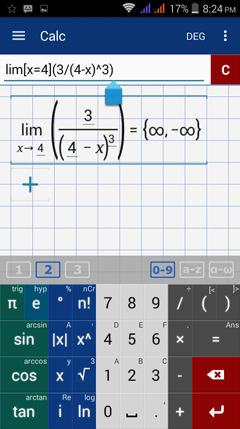
Type in: lim [ x = 4 ] ( 3 / ( 4 - x )^3 )
Type in: lim [ x = 4 ] ( 3 / ( 4 - x )^3 )
Calculator solution
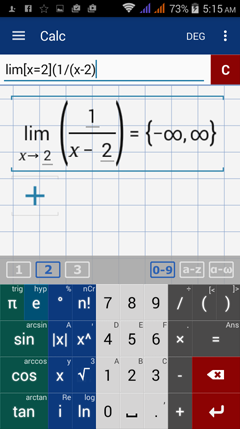
Type in: lim [ x = 2 ] ( 1 / ( x - 2 ) )
Type in: lim [ x = 2 ] ( 1 / ( x - 2 ) )
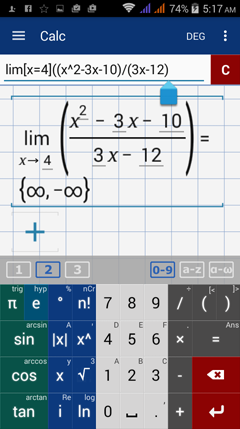
Calculator solution
Type in: lim [ x = 4 ] ( ( x^2 - 3x - 10 ) / ( 3x - 12 ) )
Type in: lim [ x = 4 ] ( ( x^2 - 3x - 10 ) / ( 3x - 12 ) )