11.5 Absolute Value Functions
An absolute value function involves taking the absolute value of the independent variable. Some examples are y = |2x - 1|
and f(x) = 2 - |x|.
To graph an absolute value function:
1) If the equation is written as f(x), replace f(x) with y.
Note: If the function is defined explicitly as "y =" or "f(x)," you only need to enter the function's expression.
2) Enter the absolute value expression use the | | (absolute value) keys and write the argument in parentheses.
3) If the equation is defined implicitly, enter the entire equation as given.
4) Sketch multiple functions on the same coordinate axes by entering one equation per line.
Examples
Sketch the graphs of the following:
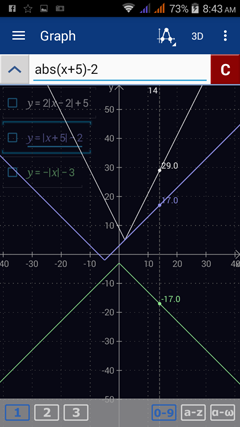
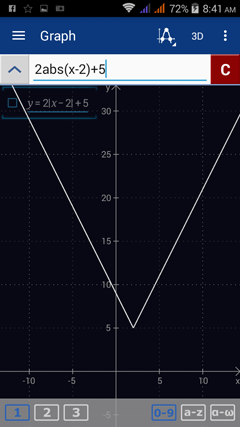
1. y = 2|x – 2| + 5
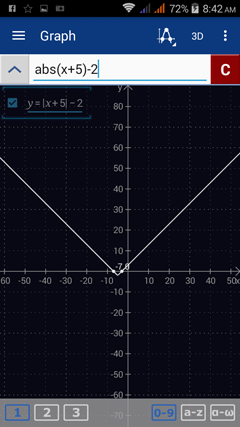
2. y = |x + 5| - 2
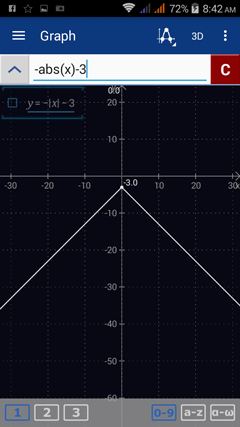
3. y = -| x | - 3
Calculator solutions
Enter each expression using the absolute value key |x| and entering the argument in parentheses.
1) Enter y = 2|x – 2| + 5. It should appear as: "2abs(x - 2) + 5." Hit enter to go to a new line.
2) Enter y = |x + 5| - 2. It should appear as: "abs(x + 5) - 2." Hit enter.
3) Enter y = -| x | - 3. It should appear as "-abs(x) - 3."
and f(x) = 2 - |x|.
To graph an absolute value function:
1) If the equation is written as f(x), replace f(x) with y.
Note: If the function is defined explicitly as "y =" or "f(x)," you only need to enter the function's expression.
2) Enter the absolute value expression use the | | (absolute value) keys and write the argument in parentheses.
3) If the equation is defined implicitly, enter the entire equation as given.
4) Sketch multiple functions on the same coordinate axes by entering one equation per line.
Examples
Sketch the graphs of the following:
1. y = 2|x – 2| + 5
2. y = |x + 5| - 2
3. y = -| x | - 3
Calculator solutions
Enter each expression using the absolute value key |x| and entering the argument in parentheses.
1) Enter y = 2|x – 2| + 5. It should appear as: "2abs(x - 2) + 5." Hit enter to go to a new line.
2) Enter y = |x + 5| - 2. It should appear as: "abs(x + 5) - 2." Hit enter.
3) Enter y = -| x | - 3. It should appear as "-abs(x) - 3."
To look at each equation separately, enter one equation per workspace.
1) y = 2|x – 2| + 5
2) y = |x + 5| - 2
3) y = -| x | - 3