11.2. Graphing Functions
Method 1: Type in the Equation of the Function as Given
In Graph mode, enter the equation into the input field as it appears in the problem.
Examples
Sketch the graphs of the following functions:
Calculator solutions
Enter each equation into the input field.
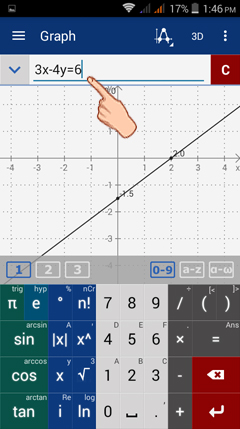
1) Type in: 3x - 4y = 6
1) Type in: 3x - 4y = 6
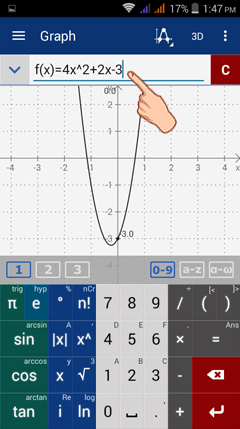
2) Type in: f(x) = 4x^2 + 2x - 3
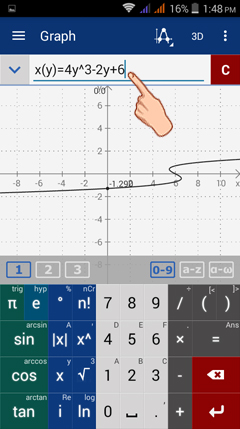
3) Type in: x(y) = 4y^3 - 2y + 6
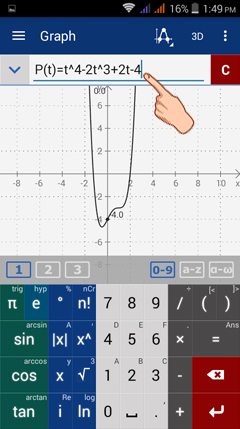
4) Type in: P(t) = t^4 - 2t^3 + 2t - 4
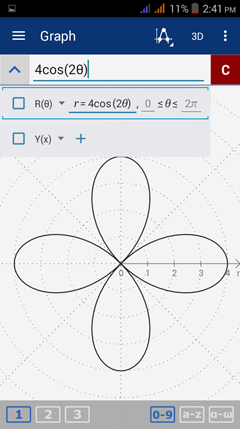
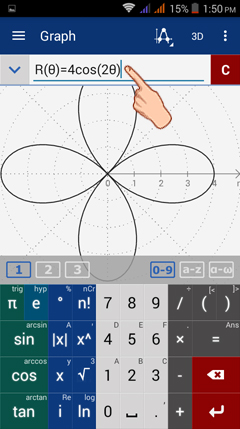
5) Type in: R(θ) = 4cos(2θ)
Method 2: Use the Function Buttons
Use the scroll-down menu underneath the brown square with v shape on the left side of the input field to select a function. Listed below are the functions found in the scroll menu:
Y(x) - graph an equation where x is an independent variable and y is the dependent variable
X(y) - graph an equation where y is an independent variable and x is the dependent variable
F(x, y) - graph a function defined in x and y
P(t) - graph any parametric equation
R(θ) - graph a polar equation
[x , y] - plot an ordered pair
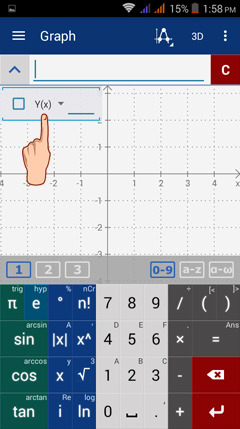
Tap the function key to activate it.
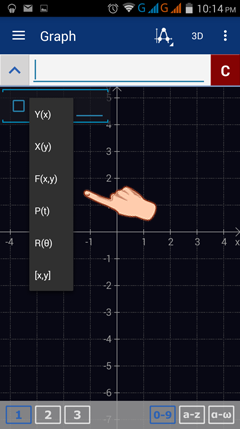
Y(x) - graph an equation where x is an independent variable and y is the dependent variable
X(y) - graph an equation where y is an independent variable and x is the dependent variable
F(x, y) - graph a function defined in x and y
P(t) - graph any parametric equation
R(θ) - graph a polar equation
[x , y] - plot an ordered pair
Tap the function key to activate it.
Special Note!
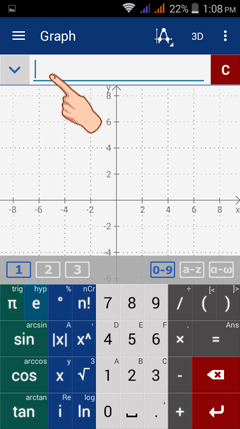
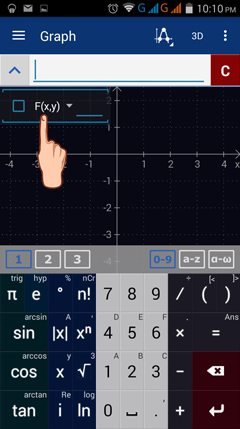
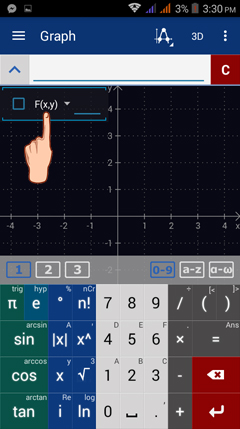
To show the function list (or scroll-down menu), tap the brown square button (with v-shape) at the left-hand side of the input bar.
To show the function list (or scroll-down menu), tap the brown square button (with v-shape) at the left-hand side of the input bar.
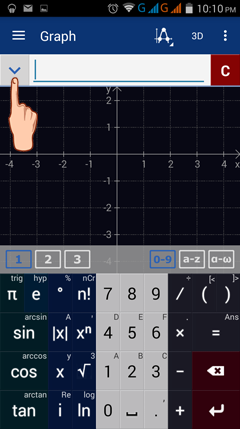
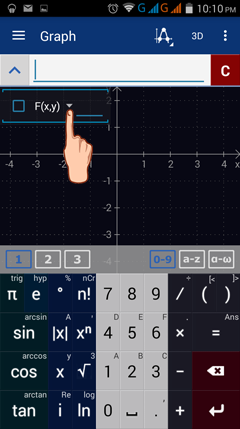
Then, a square button, one function key and a small triangle, respectively appear right below the input bar. See sample image below.
Tap the small inverted triangle, situated at the right of the function key, to show the other functions in the list.
The complete list of functions is shown in the scroll-down menu.
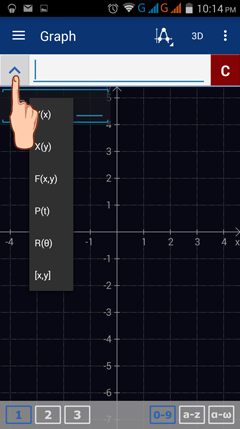
Tap the inverted v button to hide the list back.
Using the Function Keys to Sketch Graph
Activate the appropriate function key for a given equation. Then, key in the equation into the input field.
Examples
Sketch the graph of each equation below using the desired function button.
Sketch the graph of each equation below using the desired function button.
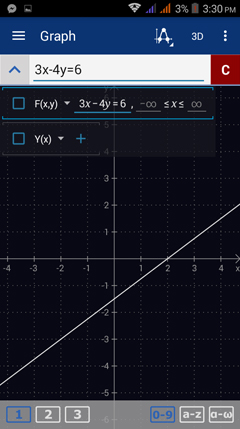
1) F(x, y) = 3x - 4y = 6
Select F(x, y) in the scroll-down menu. Then type in: 3x - 4y = 6.
Select F(x, y) in the scroll-down menu. Then type in: 3x - 4y = 6.
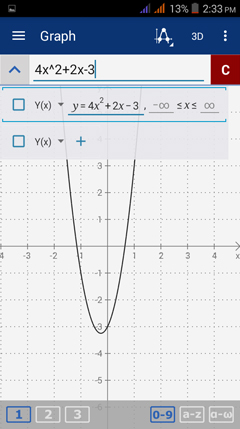
2) f(x) = 4x^2 + 2x - 3
Because the function is defined in terms of x, select Y(x) in the scroll-down menu. Then type in: 4x^2 + 2x - 3.
Because the function is defined in terms of x, select Y(x) in the scroll-down menu. Then type in: 4x^2 + 2x - 3.
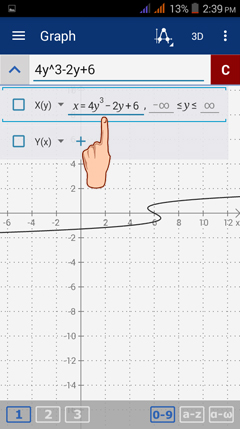
3) x(y) = 4y^3 - 2y + 6
Since the function is defined in terms of y, select X(y) from the scroll-down menu. Then type in: 4y^3 - 2y + 6.
Since the function is defined in terms of y, select X(y) from the scroll-down menu. Then type in: 4y^3 - 2y + 6.
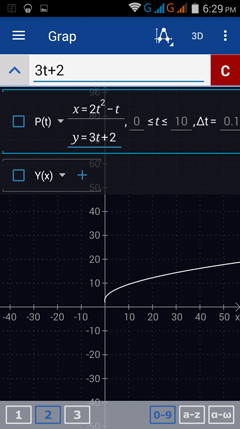
4) x(t) = 2t^2 - t
y(t) = 3t + 2
Select P(t) from the scroll-down menu and type in: 2t^2 - t.
Tap the enter key.
Type 3t + 2.
The graph is shown below.
y(t) = 3t + 2
Select P(t) from the scroll-down menu and type in: 2t^2 - t.
Tap the enter key.
Type 3t + 2.
The graph is shown below.
|
5) R(θ) = 4 cos(2θ)
Select R(θ) from the scroll-down menu and type in: 4 cos(2θ).
Select R(θ) from the scroll-down menu and type in: 4 cos(2θ).