19.7. Measures of Position
Measures of position tell us the relative position of a data value.Two of the most commonly used measured are the
z-score and quantiles.
Z - score
The z-score gives us the distance of a data value relative to the mean of the distribution, measured in standard deviations. A negative z-score means that the data value is located below the mean, while a position z-score tells us that the data value is above the mean. To calculate the z-score, use either of the following formulas depending on whether the data set is a sample or a population:
To find the z-score using the app, use the following steps:
1) Enter the data set as a matrix.
2) Use the syntax:
(x - avg(A)) / stdev(A) if the data represents a sample
(x - avg(A)) / stdevp (A) if the data represents a population
Examples
Find the z-score of each value in the following data set. Are any of them outliers?
Note: A data value is an outlier if its z-score is greater than 3 or less than -3.
Data set: 3, 4, 5, 8, 75
Calculator solution
1) Enter the data set as a matrix.
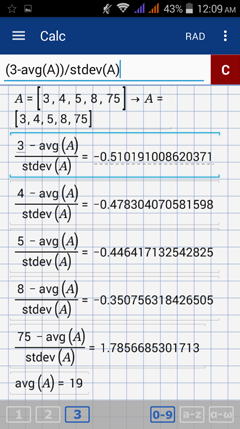
A = [3, 4, 5, 8, 75]
2) Compute the z-score for each data value. Use the syntax: (x - avg(A)) / stdev(A)
x z
3 - 0.51
4 - 0.48
5 - 0.45
8 - 0.35
75 1.79
The negative z-scores mean that the data values 3, 4, 5 and 8 are located below the mean (19). Since 75 has a positive z-score, it means that the value 75 is located above the mean. More specifically, the data value 3 is located 0.51 standard deviations below the mean, for example. In addition, the data set has no outliers based on z-scores since no value is farther than 3 standard deviations from the mean.
1) Enter the data set as a matrix.
2) Use the syntax:
(x - avg(A)) / stdev(A) if the data represents a sample
(x - avg(A)) / stdevp (A) if the data represents a population
Examples
Find the z-score of each value in the following data set. Are any of them outliers?
Note: A data value is an outlier if its z-score is greater than 3 or less than -3.
Data set: 3, 4, 5, 8, 75
Calculator solution
1) Enter the data set as a matrix.
A = [3, 4, 5, 8, 75]
2) Compute the z-score for each data value. Use the syntax: (x - avg(A)) / stdev(A)
x z
3 - 0.51
4 - 0.48
5 - 0.45
8 - 0.35
75 1.79
The negative z-scores mean that the data values 3, 4, 5 and 8 are located below the mean (19). Since 75 has a positive z-score, it means that the value 75 is located above the mean. More specifically, the data value 3 is located 0.51 standard deviations below the mean, for example. In addition, the data set has no outliers based on z-scores since no value is farther than 3 standard deviations from the mean.
Quantile Measures
Percentiles and quantiles are also common measures. For example, percentiles are often used for ranking students in terms of scores for any standardized exam.
A percentile is a quantile measure that divides the distribution into 100 equal parts, the lowest being the 0th percentile and the highest being the 100th percentile although realistically, a data set can only have 99 percentiles. The kth percentile means that k% of the values lie below the value. For instance, at the 5th percentile, 5% of the data lie below the value while 95% of the data lie above it.
A decile is a quantile measure that divides a data set into 10 equal parts, the lowest being the 0th decile and the highest being the 10th decile, but a data set can only have 9 deciles. The kth decile means that k*10% of the data lies below it and (100-10k)% of the data lies above. D6, for example, means that 60% of the data lies below this value, and 40% lies above it.
Like quartiles, finding deciles and percentiles can be difficult for larger data sets. You can use the app to calculate any quantile measure using the steps below:
1) Enter the data set as a matrix.
2) Convert the rank (decile, percentile, quartile) into a percent and then to a decimal.
Q1 = 25% = 0.25
Q2 = 50% = 0.5
Q3 = 75% = 0.75
D1 = 1*10 % = 0.1
D2 = 2*10% = 0.2
D3 = 30% = 0.3
D4 = 40% = 0.4
.
.
.
D9 = 90% = 0.9
P1 = 1% = 0.01
P2 = 2% = 0.02
P3 = 3% = 0.03
.
.
.
P99 = 99% = 0.99
3) Use the syntax: quantile(matrix name, decimal equivalent of the percent)
Examples
Find the following quantiles of the data set below.
12, 5, 6, 9, 10, 2, 1
1) Q2
2) P20
3) D4
4) D8
5) P60
Calculator solutions
Enter the data set as a matrix.
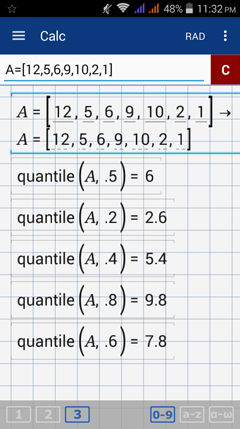
A = [12, 5, 6, 9, 10, 2, 1]
Convert each rank to percent. Then, to decimal.
1) Q2 = P50, k = 0.50 Command: quantile(A, 0.50)
2) P20, k = 0.20 Command: quantile(A, 0.20)
3) D4 = P40, k = 0.40 Command: quantile(A, 0.40)
4) D8 = P80, k = 0.80 Command: quantile(A, 0.80)
5) P60, k = 0.60 Command: quantile(A, 0.60)


