19.8.3. Scatter Plot and Regression Line
A scatter plot shows the relationship between two variables, such as age and height, graphically with the independent variable on the x-axis and the dependent variable on the y-axis.
To sketch a scatter plot of a data set, use the following steps:
1) Switch to Graph mode by going to Menu > Graph.
2) Enter the data by Plotting Points
3) Check the square box on the left of the coordinates enclosed in brackets
to find the equation of the regression line, or the line of best fit.
The equation is displayed below the input field.
If there is a relationship between X and Y, the regression line can be used to predict the estimated value of the dependent variable Y given a value of X.
Example
Sketch the scatter plot of the data set below. Then find the equation of the regression line.
| x | 2 | 4 | 7 | 9 | 11 | 15 | 12 |
| y | 5 | 8 | 3 | 16 | 12 | 21 | 25 |
Calculator solution
Switch to the Graph Mode. Select the [x,y] type of function. Click the button on the right side of the input field to enter the data.
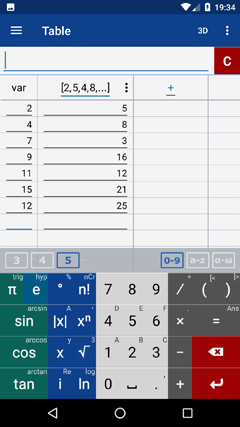
As a result, the app switches to the Table Mode for entering coordinates of points to the table
(2, 5), (4, 8), (7, 3), (9, 16), (11, 12), (15, 21), (12, 25).
Switch to the Graph Mode. Select the [x,y] type of function. Click the button on the right side of the input field to enter the data.
As a result, the app switches to the Table Mode for entering coordinates of points to the table
(2, 5), (4, 8), (7, 3), (9, 16), (11, 12), (15, 21), (12, 25).
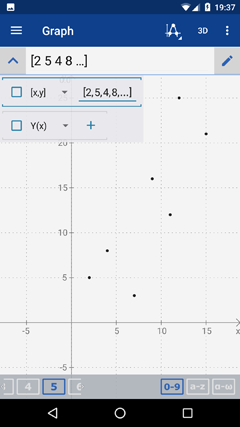
Use the main menu to switch back to the Graph Mode to see points on the graph.
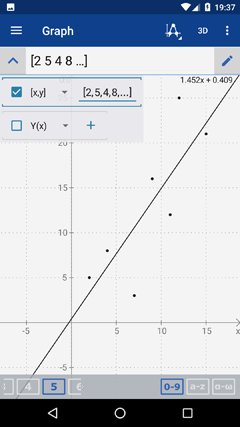
Check the square box on the left of the coordinates enclosed in brackets.
The equation of the regression line is y=1.452x+0.409
The equation of the regression line is y=1.452x+0.409


