11.3. Setting the Applied Domain of a Function
The applied domain of a function is the constrained interval of values where the function is relevant.
Example
Suppose a rental company charges $15 to rent a car plus $0.20 for each mile driven up to 2500 miles. Define a function to model the cost of renting a car.
Solution
If we let y = the cost of renting a car and x = the distance in terms of miles driven, the function of the cost is y = $0.20x + $15. Because the cost of renting a car and the distance driven cannot be negative, the applied domain of the function must be positive such that 0 < x < 2500 with 2500 as the maximum distance.
To graph y = 0.20x + 15 with an applied domain of 0 < x < 2500,
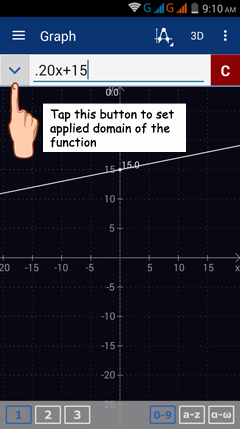
Step 1: In Graph mode, enter 0.20x + 15 in the input field.
Step 2: Tap the down-arrow on the left of the input field to display the equation and its default interval of values for x: (-∞, x, ∞).
Note: the default interval does not necessarily match the relevant domain of the function, especially for rational, radical, exponential and inverse functions that have restricted domains.
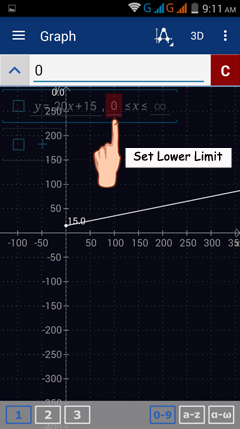
Step 3: To set the lower limit of the applied domain, tap -∞. Then type 0 in the input field.
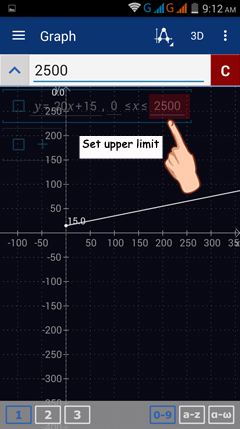
Step 4: To set the upper limit of the applied domain, tap ∞. Then type 2500 in the input field.
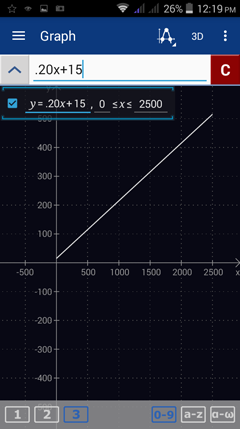
Step 5: In the workspace, the line segment will be restricted from 0 to 2500 as shown below.
More Examples
Sketch the graph of each function defined at the given interval of values.
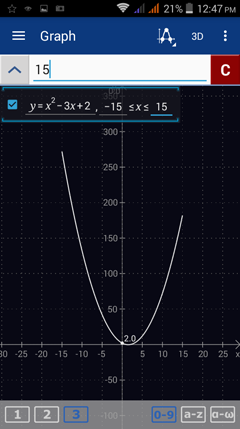
1) f(x) = x^2 - 3x + 2 ; -15 < x < 15
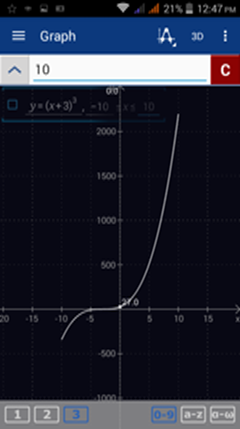
2) g(x) = (x + 3)^3 ; -10 < x < 10
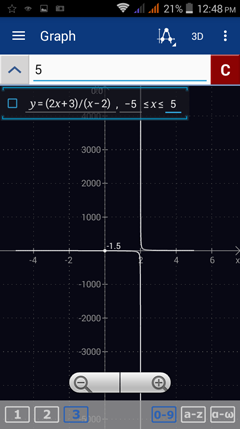
3) h(x) = (2x + 3) / (x - 2); -5 < x < 5
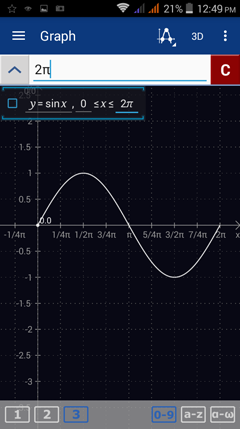
4) y = sin x ; 0 < x < 2π
Solutions
1) f(x) = x^2 - 3x + 2 ; -15 < x < 15
Enter the expression as it appears: x^2 - 3x + 2
Tap the down-arrow on the left of the input field.
Tap -∞ and type -15 in the input field.
Tap ∞ and type 15 in the input field.
2) g(x) = (x + 3)^3 ; -10 < x < 10
Enter the expression as it appears: (x + 3)^3
Tap the down-arrow on the left of the input field.
Tap -∞ and type -10 in the input field.
Tap ∞ and type 10 in the input field.
Enter the expression as it appears: (x + 3)^3
Tap the down-arrow on the left of the input field.
Tap -∞ and type -10 in the input field.
Tap ∞ and type 10 in the input field.
3) h(x) = (2x + 3) / (x - 2); -5 < x < 5
Enter the expression as it appears: (2x + 3)/(x - 2)
Tap the down-arrow on the left of the input field.
Tap -∞ and type -5 in the input field.
Tap ∞ and type 5 in the input field.
Enter the expression as it appears: (2x + 3)/(x - 2)
Tap the down-arrow on the left of the input field.
Tap -∞ and type -5 in the input field.
Tap ∞ and type 5 in the input field.
4) y = sin x ; 0 < x < 2π
Enter the expression as it appears: sinx
Tap the down-arrow on the left of the input field.
Tap -∞ and type 0 in the input field.
Tap ∞ and type 2π in the input field.
Note: To display x-values in terms of π, go to Settings > Graph > x-axis > Radians.
Enter the expression as it appears: sinx
Tap the down-arrow on the left of the input field.
Tap -∞ and type 0 in the input field.
Tap ∞ and type 2π in the input field.
Note: To display x-values in terms of π, go to Settings > Graph > x-axis > Radians.

