4.11. Special Points: Roots and Criticals
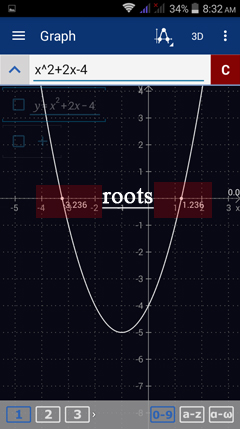
Roots of a function refer to the values of the independent variable (usually x) that make the function equal to zero. For instance, the value of the function f(x) = 3x - 6 is 0 when x = 2. That is, f(2) = 0. Thus x = 2 is the root of the linear function f(x) = 3x - 6.
Critical points of a function refer to the values of the independent variable (often x) that make the derivative of the function equal to 0. Suppose f(x) = x^2 + 2x - 4. The derivative of f(x) is f '(x) = 2x + 2 which is 0 when x= -1, i.e. f'(-1) = 0. Therefore (-1, f(-1)) is a critical point on f(x) and x= -1 is a critical value of x.
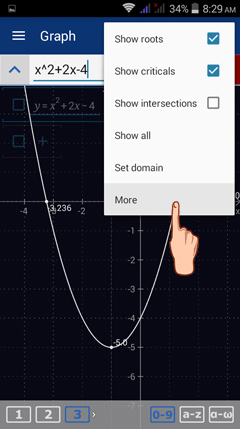
To check for the roots and critical points of a function displayed in the graphing area, tap the Special points icon in the upper right-hand corner (next to the 3D option) of the Graph window.
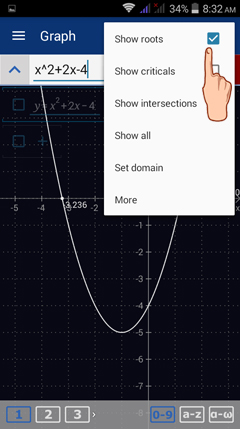
Check Show roots to see the roots of the function being graphed. The roots will automatically be displayed.
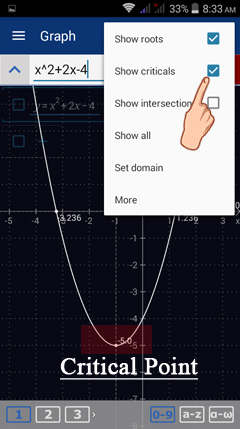
Check Show criticals to see the critical points. The critical points are automatically shown on the graph of the function.
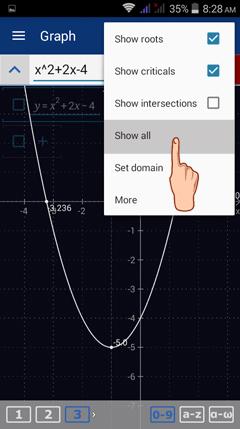
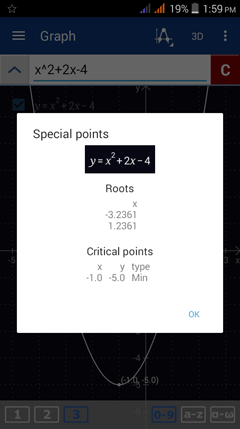
Check both options and tap Show all to see the roots and critical points given as ordered pairs (with both x- and y-coordinates). The critical points are also classified depending on whether they are a minimum, a maximum or a discontinuity in the graph.
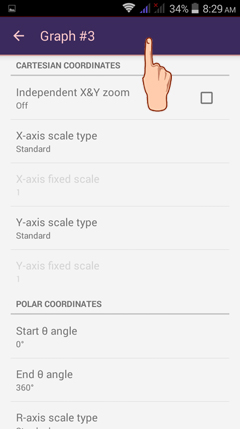
More Graph Options
To see the graph settings for the function displayed, tap MORE. You will be redirected to the Settings window for your current workspace area.