2.3 Graph Settings
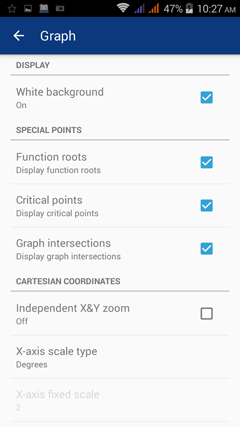
DISPLAY
White background
Check to use a white background for graphs.
SPECIAL POINTS
Check to display function roots, critical points and graph intersections while in Graph mode.
To turn special points on or off for a particular graph, tap the special points icon beside it (3D or 2D icon - whichever is active). Check the specific special points you want to display or tap "show all" to display all special points.
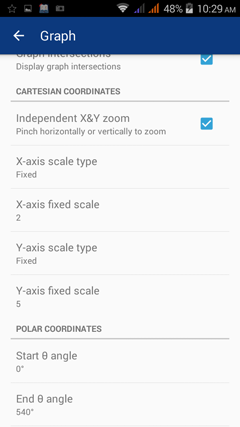
CARTESIAN COORDINATES
Individual X and Y Axis Zoom
Check to activate horizontal or vertical pinching to zoom in or out of the graph.
Axis scale type
Changes X- or Y-axis scale type.
Standard - standard decimal scale. Pinch to zoom in and out or use zoom controls.
Degrees - scale in degrees. Useful for trigonometric functions.
Radians - scale in multiples of π. Useful for trigonometric functions.
Fixed - fixed, non-resizable scale. Use the next setting to set the scale step.
Axis fixed scale
Set the fixed X- or Y-axis scale step size.
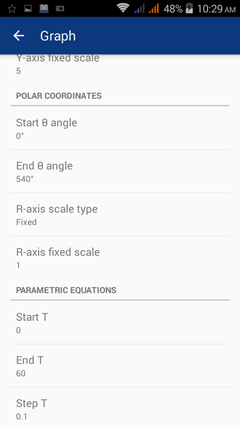
POLAR COORDINATES
Start and end θ angle
Set the start and end θ angle for graphs in polar coordinates.
R-axis scale type and R-axis fixed scale
Change the scale type and step for the R-axis. See Cartesian coordinates.
Start and end θ angle
Set the start and end θ angle for graphs in polar coordinates.
R-axis scale type and R-axis fixed scale
Change the scale type and step for the R-axis. See Cartesian coordinates.
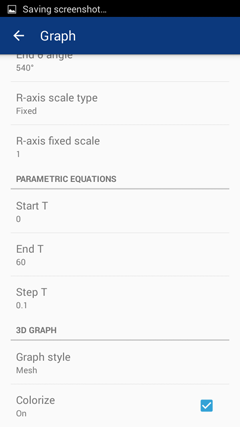
PARAMETRIC EQUATIONS
Default start, end and T step
Set the default range and step for the T variable.
Write parametric equations on 2 lines, e.g.:
x = sin t
y = cos t
You can change the range and step for individual equations after you enter them in Graph mode.
Default start, end and T step
Set the default range and step for the T variable.
Write parametric equations on 2 lines, e.g.:
x = sin t
y = cos t
You can change the range and step for individual equations after you enter them in Graph mode.
3D Graph Setting
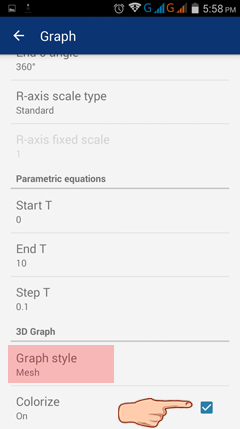
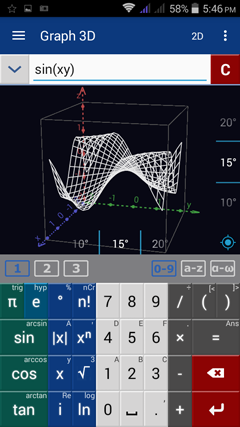
Set the graph style to either mesh or dots. Checking Colorize allows colorization. Turning off colorization yields a graph in black and white. See the sample graph below.
Set the graph style to either mesh or dots. Checking Colorize allows colorization. Turning off colorization yields a graph in black and white. See the sample graph below.

