Chapter 13. Trigonometric Functions and their Inverses
13.1 Degree and Radian Key
13.1.1 Degrees, Minutes and Seconds
13.1.2 Bradis Table
13.2 Trigonometric Function keys
13.3 Trigonometric Values of Special Angles
13.3.1 The 45°-45°-90° Right Triangle
13.3.2 The 30°-60°-90° Right Triangle
13.3.3 Quadrantal Angles
13.3.4 Coterminal Angles
13.4 Applying Trigonometric Identities
13.5 Hyperbolic Function keys
13.6 Graphing Trigonometric Functions
13.7 Graphing Hyperbolic Functions
13.8 Graphing Inverse Functions
13. Trigonometric Functions
A trigonometric function (also known as a circular function) is a function of an angle that contains an expression involving sine, cosine, tangent, cosecant, secant or cotangent. It relates the angles of a triangle and the lengths of its sides. When graphed on a coordinate plane, the x-axis is expressed in radians or degrees and the y-axis is in standard real numbers. To use a radian or degree scale for the x-axis, go to Menu > Settings > Graph > x-axis scale type > Radians (or degrees).
To graph a trigonometric function:
1) If the equation is defined explicitly i.e. "y =," enter only the trigonometric function.
2) If the equation is defined implicitly, enter the entire equation as given.
3) To sketch graphs on the same coordinate axes, enter one equation per line.
Examples
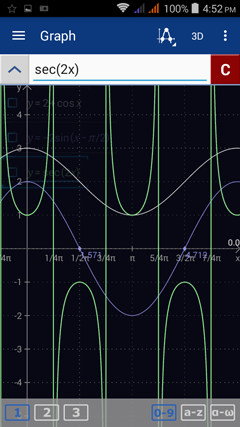
Sketch the graphs of:
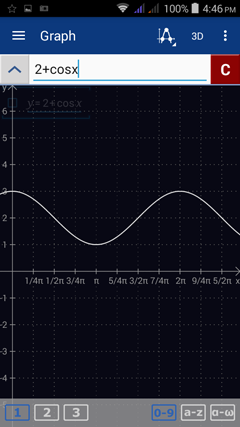
1. y = 2 + cos x
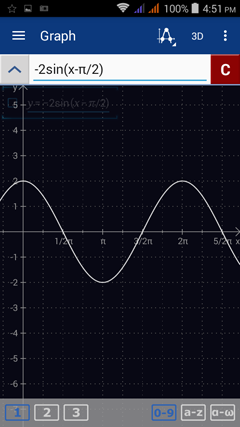
2. y = -2 sin (x – π/2)
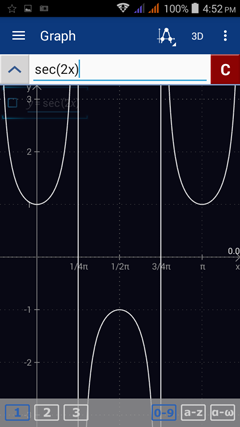
3. y = sec2x
Calculator solutions
Make sure that the trigonometric keys are available on the keyboard. If not, hold the π key to display them.
Enter the expressions as given.
1) 2 + cos x
2) -2 sin (x – π/2)
3) sec2x
Enter secant by tapping cos three times.
To graph a trigonometric function:
1) If the equation is defined explicitly i.e. "y =," enter only the trigonometric function.
2) If the equation is defined implicitly, enter the entire equation as given.
3) To sketch graphs on the same coordinate axes, enter one equation per line.
Examples
Sketch the graphs of:
1. y = 2 + cos x
2. y = -2 sin (x – π/2)
3. y = sec2x
Calculator solutions
Make sure that the trigonometric keys are available on the keyboard. If not, hold the π key to display them.
Enter the expressions as given.
1) 2 + cos x
2) -2 sin (x – π/2)
3) sec2x
Enter secant by tapping cos three times.
To look at each graph individually, enter one equation per workspace.

More Examples
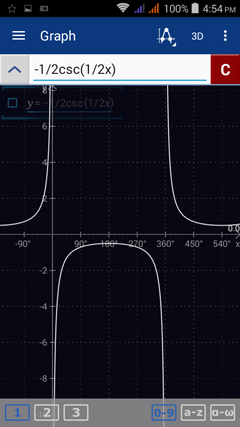
1. y= -1/2 csc ½ x
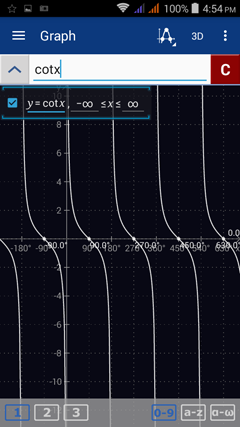
2. y = cot x
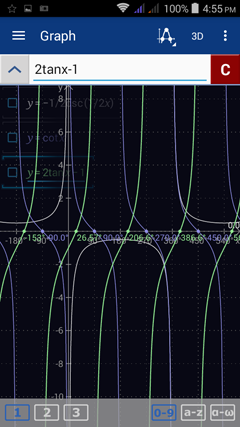
3. y = 2 tanx – 1
Calculator solutions
Enter each expression as given.
1) -1/2 csc ½ x
Enter cosecant by tapping sin three times.
2) cot x
Enter cotangent by tapping tan three times.
3) 2 tanx – 1
1. y= -1/2 csc ½ x
2. y = cot x
3. y = 2 tanx – 1
Calculator solutions
Enter each expression as given.
1) -1/2 csc ½ x
Enter cosecant by tapping sin three times.
2) cot x
Enter cotangent by tapping tan three times.
3) 2 tanx – 1
To look at each graph individually, enter one equation per workspace.