5.1. Sharing Functions
Table Mode shares the same functions sketched in Graph Mode and automatically displays a table for the graph's x and y values. The ordered pairs in the table are respectively the coordinates that lie on the curve of the function being graphed.
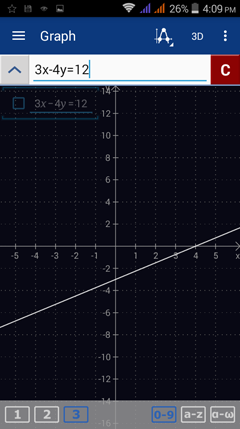
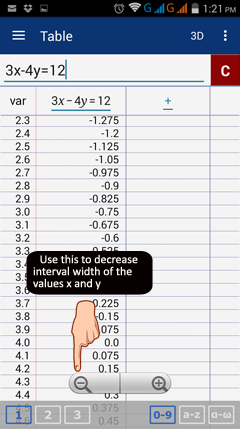
Example: Find at least ten points that solve the linear equation 3x - 4y = 12.
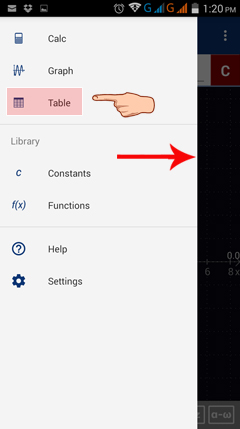
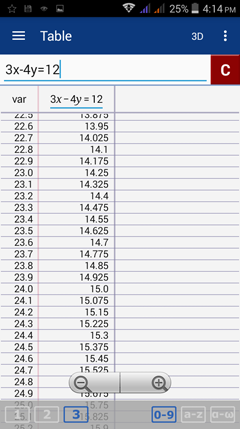
Solution: Enter the equation into the input field in Graph Mode. Then tap the menu button in the top left corner and switch to Table Mode. The table lists all sets of points that lie on 3x - 4y = 12 and solve the equation.
The column "var" shows the values of the independent variable (usually x). The next column shows the values of the defined equation (y) for every x.
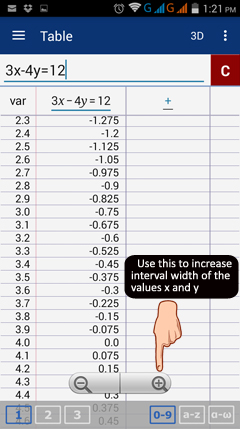
Tap the table to use the zoom control buttons to adjust the step size or interval of values for both x and y.
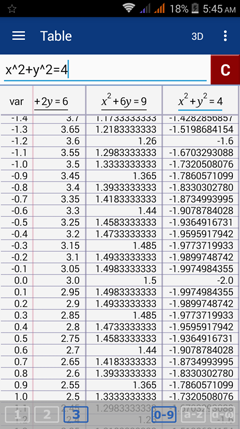
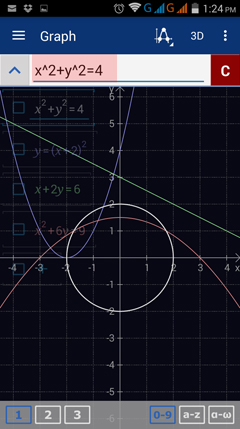
Additional functions may be entered directly in the table window. Type in a new function in the input field and another column will appear listing its y values. Tap and drag the table to see these values. A graph of the function will automatically be added in Graph Mode.

