14.3.5. Other Polar Graphs
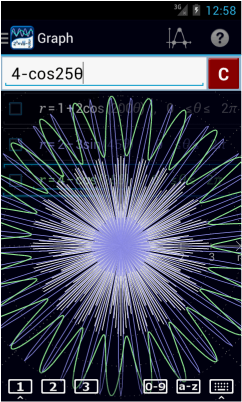
Enter the equation as it appears in the problem. The coordinate plane will automatically switch to the polar coordinate system. You do not have to enter “r =” if it is implied.
Examples
Sketch the graph of the equations below and hit enter after each one.
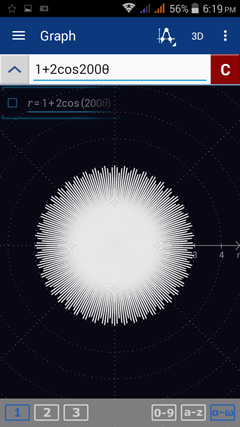
1. r = 1 + 2 cos 200 θ
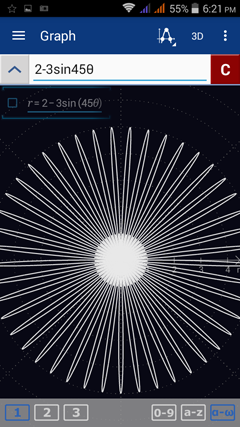
2. r = 2 – 3 sin 45 θ
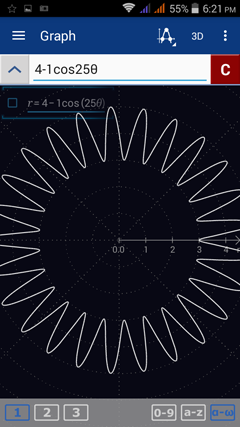
3. r = 4 – 1 cos 25 θ
Calculator solutions
Enter each of the following. Type θ by tapping the x variable key five times.
1) 1 + 2 cos 200 θ
2) 2 – 3 sin 45 θ
3) 4 – 1 cos 25 θ
Examples
Sketch the graph of the equations below and hit enter after each one.
1. r = 1 + 2 cos 200 θ
2. r = 2 – 3 sin 45 θ
3. r = 4 – 1 cos 25 θ
Calculator solutions
Enter each of the following. Type θ by tapping the x variable key five times.
1) 1 + 2 cos 200 θ
2) 2 – 3 sin 45 θ
3) 4 – 1 cos 25 θ
To look at each graph individually, enter one equation per workspace. Adjust the r-axis fixed scale to resize the graph. Set it to a smaller value (e.g. 1, 0.5, 0.3) to enlarge the scale or set it to a higher value (e.g. 3, 5) to reduce it.
More Examples
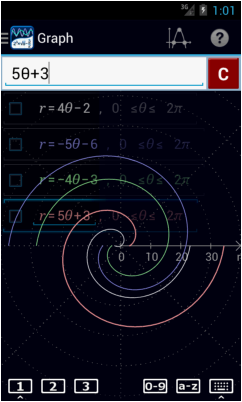
Sketch the graphs of the polar equations below and hit enter after each one.
1. r = 4 θ – 2
2. r = -5 θ – 6
3. r = -4 θ – 3
4. r = 5 θ + 3
Calculator solutions
Enter each of the following. Type θ by tapping the x variable key five times.
1) 4 θ – 2
2) -5 θ – 6
3) -4 θ – 3
4) 5 θ + 3
Sketch the graphs of the polar equations below and hit enter after each one.
1. r = 4 θ – 2
2. r = -5 θ – 6
3. r = -4 θ – 3
4. r = 5 θ + 3
Calculator solutions
Enter each of the following. Type θ by tapping the x variable key five times.
1) 4 θ – 2
2) -5 θ – 6
3) -4 θ – 3
4) 5 θ + 3

