13.4. Graphing Trigonometric Functions
When we graph periodic trigonometric functions, we refer to the function's amplitude, period, phase shift and vertical shift.
In a function such as y = a sin(bx + c) + d,
1) The amplitude a is the function's height from the center.
2) The period 2π/b is the distance between peaks.
3) The phase shift -c/b is the function's horizontal displacement.
4) The vertical shift d is the function's vertical displacement.
Before graphing a trigonometric function:
1) Go to the Menu in the top left and select Graph to enter Graph mode.
2) Go to Settings> Graph > x-axis scale type > select degrees or radians.
3) The y-axis scale type can be set to standard.
4) Type in the trigonometric function in the input field.
5) Set the applied domain from 0 to 360 degrees or from 0 to 2π radians. (Refer to section 11.2 on how to set the applied domain).
Note: if the x-axis scale is in degrees, the lower limit can be set but not the upper limit. The graph continues to infinity.
Examples
Sketch the graphs of the following:
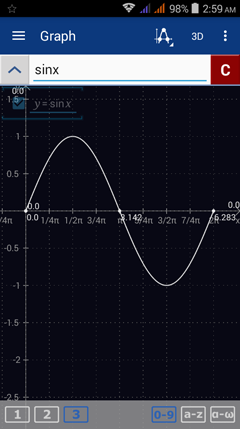
1) y = sin (x)
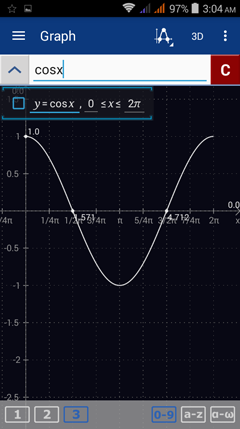
2) y = cos (x)
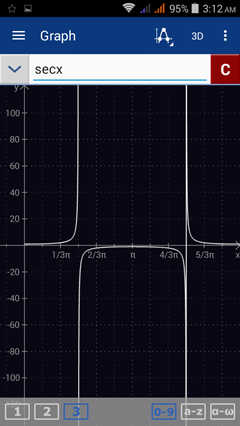
3) y = sec (x)
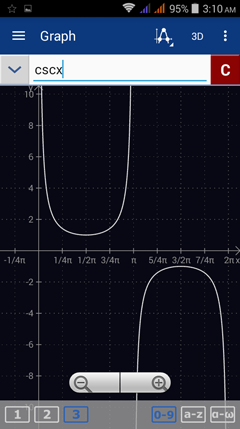
4) y = csc (x)
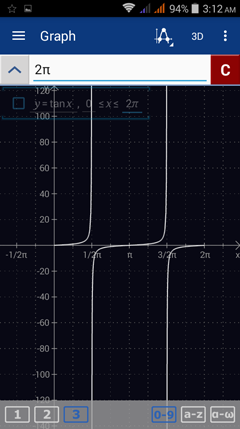
5) y = tan (x)
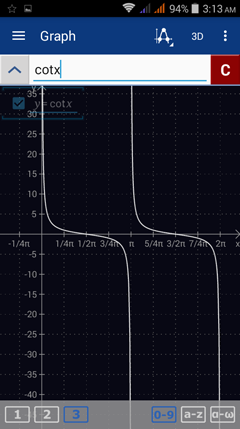
6) y = cot (x)
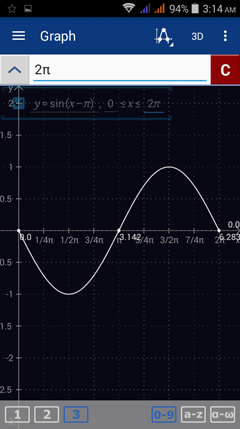
7) y = sin (x - π)
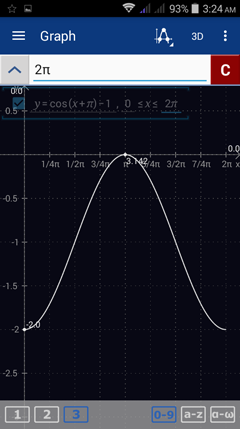
8) y = cos (x + π) - 1
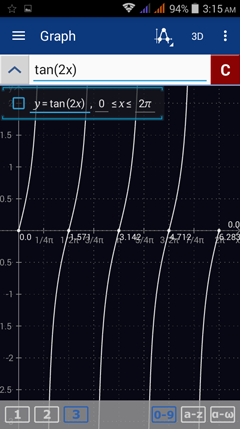
9) y = tan (2x)
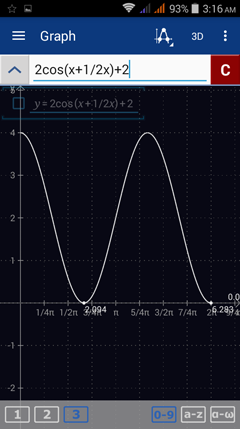
10) y = 2 cos (x + 1/2 π) + 2
Calculator solutions
1) Enter the expression as given: sinx
2) Enter the expression as given: cosx
3) Enter the expression as given: secx
Type secant by tapping cos three times.
4) Enter the expression as given: cscx
Type cosecant by tapping sin three times.
5) Enter the expression as given: tanx
6) Enter the expression as given: cotx
Type cotangent by tapping tan three times.
7) Enter the expression as given: sin(x - π)
8) Enter the expression as given: cos (x + π) - 1
9) Enter the expression as given: tan(2x)
10) Enter the expression as given: 2cos(x+ 1/2π) + 2

