Chapter 4. Graph Mode
4.1 2D Graphing
4.2 3D Graphing
4.3 Enlarging the Graph Area
4.4 Changing to White Background
4.5 Hide Keyboard
4.6 Degree or Radian Scale
4.7 Fixed Scale
4.8 R-axis Scale
4.9 Logarithmic Scale
4.10 Tracing Values and Slopes of Graphs
4.11 Special Points: Roots and Critical Points
4.12 Intersections of Graphs
4.13 Set Domain
4.14 Show All - Roots, Critical Points and Intersections
4. Graph Mode
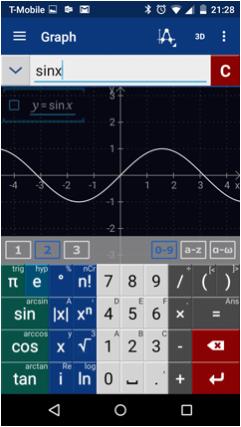
Graph mode provides a coordinate plane with a vertical y-axis and a horizontal x-axis. Gridlines are displayed for tracing points, slopes and extreme values. The default keys in Graph mode are the same keys found in Calc mode.
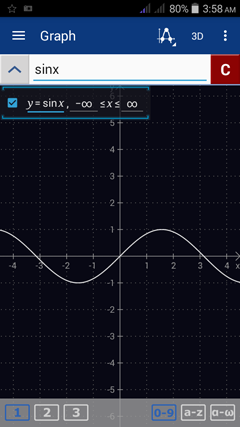
Type in a function into the input field. Tap the enter button to start a new function (Graph mode will display all equations and graphs simultaneously). Check the empty box to the left of the equation to see the domain of the function.
Type in a function into the input field. Tap the enter button to start a new function (Graph mode will display all equations and graphs simultaneously). Check the empty box to the left of the equation to see the domain of the function.