4.10. Tracing Values and Slopes of Graphs
Tracing Values and Slopes of Graphs
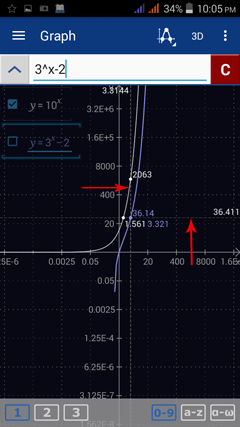
To trace y-values, tap the y-axis and drag the line left or right toward any point on the graph. The number that appears at the intersection of the trace line and the function is the value of the function at that point. Tap the y-axis to hide the trace line.
To trace x-values, tap the x-axis and drag the line up or down toward any point on the graph. The number that appears at the intersection of the trace line and the function is the value of the function at that point. Tap the x-axis to hide the trace line.
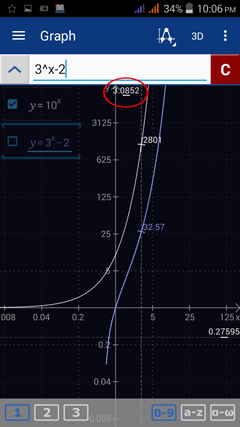
Tap the trace line to switch between values and slopes. Note that a tangent line (not a point) appears where the trace line intersects the graph.
Tap the trace line to switch between values and slopes. Note that a tangent line (not a point) appears where the trace line intersects the graph.


